Revenue rich but profit poor.
It’s a struggle growing businesses know well. Especially ecommerce businesses moving from $10M in annual revenue to $50M and beyond.
Top-line gains might have worked in the past. They might still work if you’ve got a venture-capital-backed war chest.
For most of us, however, winning means dollars in your pocket.
If you feel like you’re just surviving — like you have just enough cash in the bank month over month. Or worse, if you don’t … then what you need is a reliable framework for measuring performance while increasing profit.
That framework is unit economics: the rules of the game.
We’ll start by showing you how to strip your business model down to the bare minimum of “one unit.” Then, demonstrate how to create a better business model that not only improves your bottom line but also fuels profitable growth.
Here’s how we’ll get there:
- Understanding Unit Economics
- Counting the Cost(s): Variable vs Fixed
- Fueling Customer Acquisition Costs with Profits
- Accelerating Customer Lifetime Value & Reducing Churn
- Winning with Your Ecommerce Business Model 📊 LTV:CAC Ratio
Before we dive into the nitty-gritty …
First, download the Unit Economics & Fuel Profit Calculator so you can crunch your numbers as we go through the process:

Second, if you want a video overview of everything, we’ve got you covered:
Understanding Unit Economics: Definition
Regardless of what you sell, ecommerce business models come down to one equation with four variables.
We call it the ecommerce growth formula:

Unit economics is the process of evaluating these variables on a “per unit” basis; unearthing how the smaller, moving parts affect your overall financial model.
The goal is to answer one question:
What does it take to get one click (V), acquire a single customer (CR), retain that customer (LTV), and deliver one product (VC)?
Those are the building blocks for an actional understanding of unit economics.
And it starts with a line-item breakdown of everything that goes into getting what you sell into the hands of your customers.
Counting the Cost(s):
Variable vs Fixed
To make money (profit) you have to spend money (costs).
But, all costs are not the same.
To separate the types of costs associated with sustaining a business, categorizing them into variable versus fixed. What’s the difference?
Variable costs are created or directly affected when you make a sale. As order volume increases, so do your variable costs (VC).
Fixed costs exist independent of sales and don’t change as volume increases. Think operational expenses like rent, utilities, payroll, etc.
Compile Cost of Delivery
The biggest-bucket of variable costs is cost of delivery (COD). These include every product-related expenditure from creation to customer and back again:
- Cost of goods sold (COGS)
- Shipping and receiving
- Transaction (payment) fees
- Pick-and-pack fees
- Shipping and fulfillment
- Return rate
If you’re using the calculator …
Enter your MSRP (Retail Price) at the top. That’s the average customer order value (AOV) of one unit, including any forward shipping revenue:

For costs, enter either a dollar value (Per Unit Cost) or a percentage (Per Unit %) in each of the green boxes below Cost of Delivery …

1. Cost of Goods Sold (COGS)
Cost of goods sold (COGS) refers to the production costs of one unit. This can be the price you’ve arranged with a manufacturer or — for handmade and in-house goods — the cost of materials and labor.
Sometimes, shipping and receiving will be bundled into your COGS. For clarity, be sure to separate them into the next section.
2. Shipping and receiving
We normally think of shipping as to the customer. Here we mean packing, loading, and shipping to you or to your third-party logistics (3PL) provider. Another fee may be assessed to “breakbulk,” taking goods off of the pallet.
Storage per unit should also be included in this line item if your warehouse terms vary by volume.
3. Transaction (payment) fees
Transaction fees are also known as payment processor fees.
Alongside major credit cards, the most popular are Stripe, PayPal, and Shopify Pay. Rates start at 2.9% + $.30 per transaction but can be lowered based on your platform. Shopify Plus, for instance, offers 2.15% + $.30 on Shopify Pay.
Using apps like Klarna and AfterPay to boost conversion rates come with additional charges that must be included as well.
4. Pick-and-pack fees
After you’ve received your products, they need to be “picked” off of the shelves and “packed” to be shipped.
Whether you contract with a 3PL or run your own warehouse, it’s a job somebody has to do — which means it must be factored into your COD.
5. Shipping and Fulfillment
After COGS, shipping to the customer is the next largest cost in online retail. To mitigate, some businesses include shipping within the retail price of their products. When this is the case, then it wouldn’t be calculated into your variable costs.
Alternatively, if your business pays for shipping, then costs will vary depending on carrier, product weight, and shipping speeds.
What matters is the average cost of the one item you’re evaluating.
6. Return rate
Returns are a natural part of the sales cycle. They may include a return shipping fee and other reverse logistics charges like refund processing.
For simplicity, enter your average return rate as a percentage into the calculator. This will be multiplied by your MSRP and deducted as a dollar amount.

Calculate Gross Profit & Set a Net Profit Target
Next, we want to calculate your gross profits and establish a net target.
Gross profit is the amount of direct revenues minus the total cost of delivery. In fact, you already have gross profit — if you’ve plugged your data into the calculator.
Terminology can get a little confusing; other terms that are interchangeable with gross profit include …
- Unit margin
- Contribution margin
- And, unit contribution margin
Net profit target, on the other hand, is what we really look forward to — money in our pockets. This is the dollar amount you want to make from each product minus not just COD but all variable costs.
Determining your net target comes down to the individual needs of your business, but a good starting point would be 25% of total revenue. You’ll see where we get this magical percentage from below.
For now, enter a preliminary net target or the net target you’ve already set for the unit you’re evaluating. Then, get ready for the key to it all: fuel profit.

Fueling Customer Acquisition Costs with Profits
Customer acquisition cost equals your total marketing expenses divided by the number of new customers those expenses generate.
It’s an “all-in” number including your advertising budget, discounts and promotions, ad creative, plus any money paid to an agency or to internal employees.
The tricky part about CAC isn’t determining your current marketing costs. Instead, it’s the question: How much can you afford to spend and how much should you spend?
Answer: gross profit minus net target.
Gross profit fuels CAC. That’s why we call it “fuel profit.”
For example, if your product retails for $100 and your COD adds up to $49, then you have $51 left over to pour onto the fire of customer acquisition and still break even.

But should you spend all $51 of your gross margin?
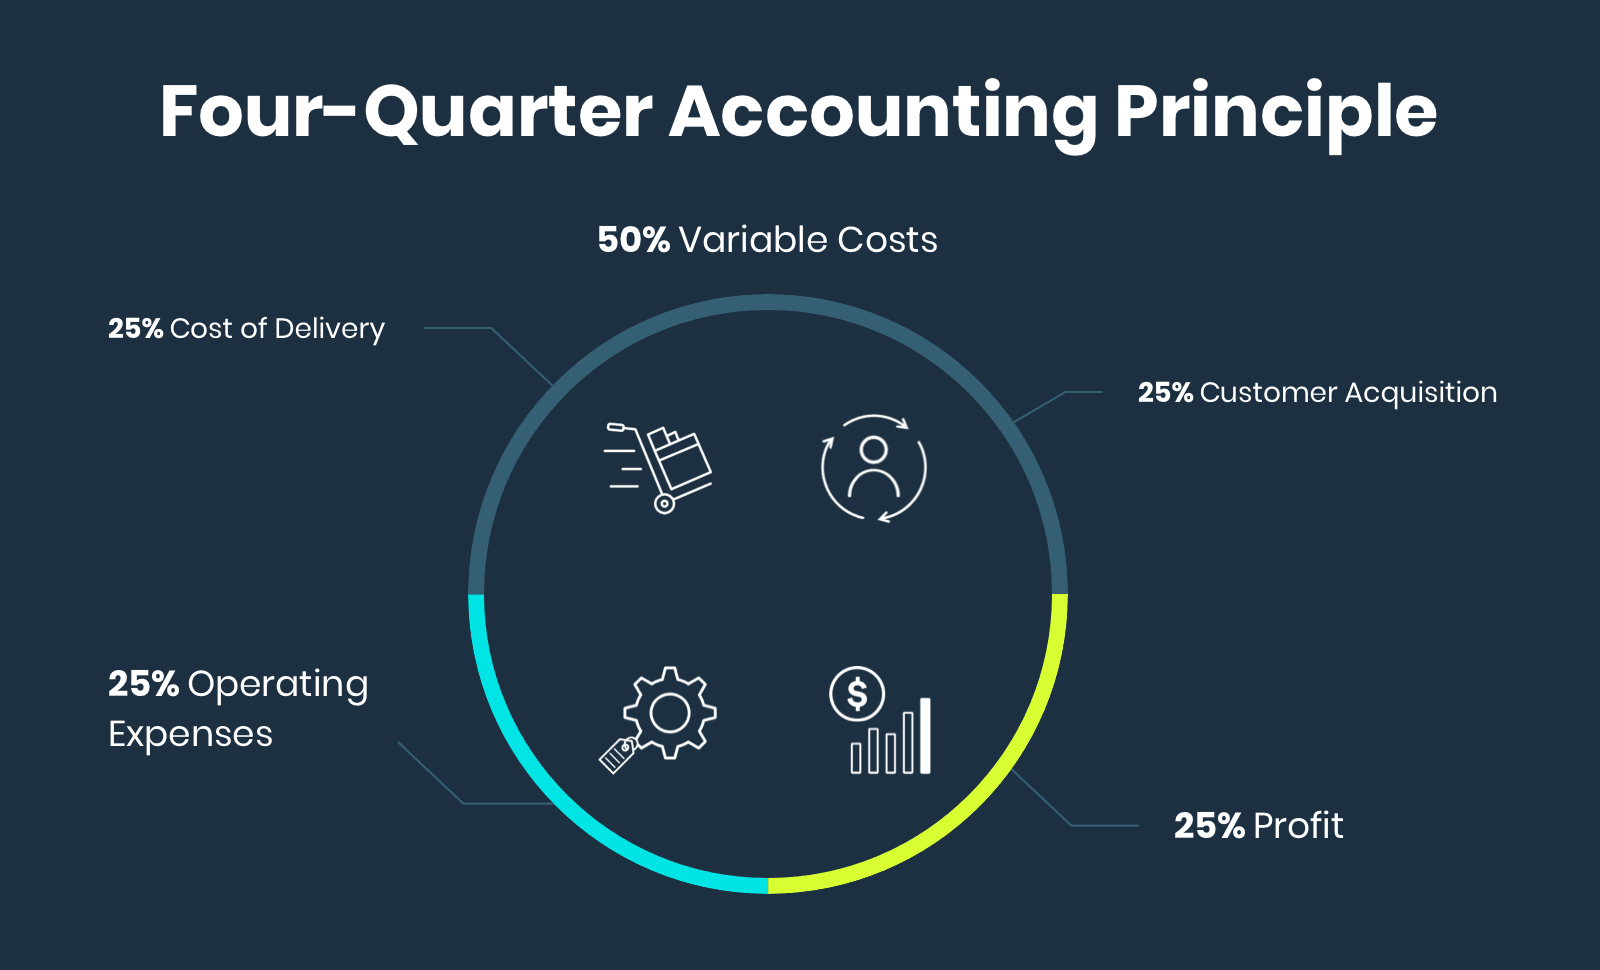
To help illustrate the point, let me introduce you to the four-quarter accounting principle. Four-quarter accounting gives you a quantitative matrix on how to allocate revenue across …
- Cost of delivery
- Customer acquisition
- Operating expenses
- And, profit
Each area should average out to ~25%. In the case of unit economics — where our goal is to understand variable costs — only factor in the first two.
A good or “green” signal would be keeping your variable costs to less than 50% of revenue.

Did that get a little confusing? Not to worry.
When determining CAC, keep it close to 25% of your gross profits.
In the calculator, you can play around with different net targets. Every time you change the dollar amount, you’ll automatically get:
- Net target per unit %
- CAC target to hit that net target
- And, a blended ROAS target to rule your advertising

And just like, you’re done! Well, done with the unit economics calculator.
There’s only one more factor you may want to consider …
Accelerating Customer Lifetime Value & Reducing Churn Rates
When you’ve mastered the basics, you can then start experimenting with how much each customer is worth to your business over time.
Typically, customer lifetime value (LTV or CLTV) is used to define this process. It’s a great term if you’re a SaaS business; terrible for ecommerce.
SaaS businesses keep variable costs to a bare minimum. Shipping costs and inventory outlays are either non-existent or extremely low. The best part is the recurring revenue due to subscriptions.
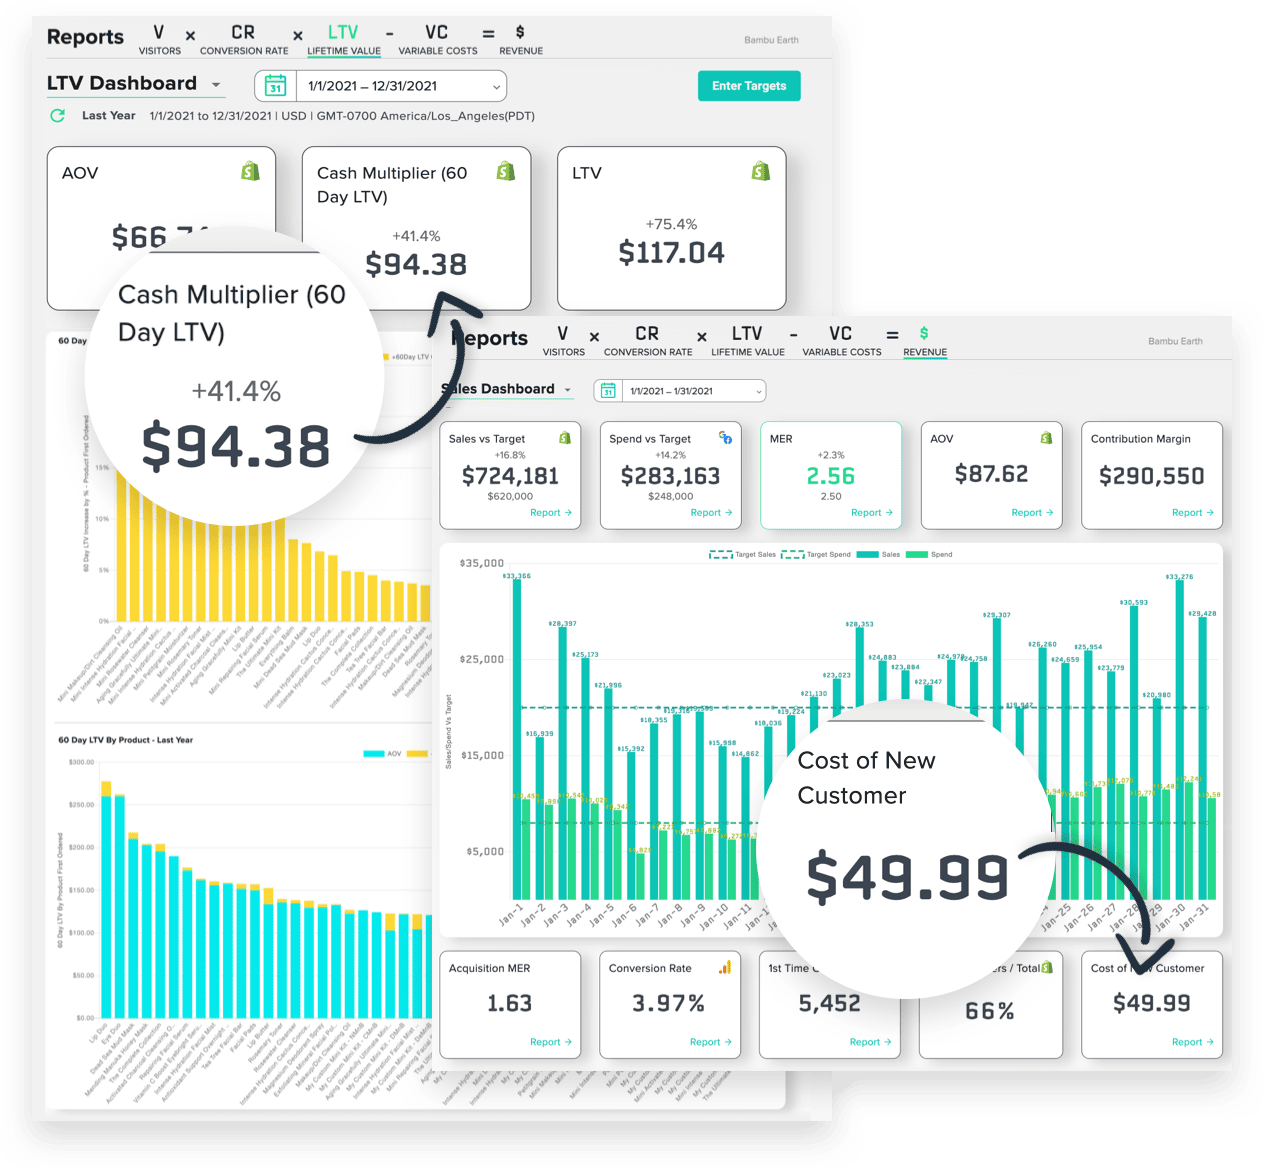
Unfortunately, you can’t afford to wait a lifetime to realize customer “lifetime” value in ecommerce. Instead, you’ll need tight payback periods. Take your total revenue for a 30, 60, or 90 day time period and divide it by the total number of customers to get what we’ve termed your “cash multiplier.”
Cash multiplier ties neatly into retention and gives you a metric to measure successes in a realistic time frame. But that’s not where things end.
You also have to make your cash multiplier make sense by setting meaningful retention benchmarks. Generally, we use the rule of 30:100 …
Businesses that can sustain growth will experience a 30% increase in their LTV within 60 days and 100% in a year.
On the flip side, if a business fails to meet these metrics, its churn rate will devour its cash flow.
For our own ecommerce business, Bambu Earth, this final concept was the key to unlocking our economics.
Putting all the units together (a true story) …
After acquiring Bambu Earth in the Spring of 2019, we couldn’t keep up with the cost of attracting new customers. What little fuel we had was diminished further by poor performance in the ad account.
In May of the first year, we did $12,360 in revenue on a 1.8 ROAS. At this rate, Bambu Earth was losing money on each and every sale. The company’s economics didn’t make sense. At least not on a per unit basis of individual sales.
We were on the verge of shutting it down. Then, we discovered something remarkable.
We always knew the product was awesome. And we had all these anecdotal stories about customers telling us they were lifelong users.
However, it wasn’t until we extended our calculations beyond individual sales into 60-day windows that we found Bambu Earth’s customers were coming back and spending an additional 40% on average.
Getting that data was a laborious process of combining ad campaigns with UTMs with specific products with Shopify customers with Google Sheets. But it was worth it.
Beneath that discovery, we maximized Bambu Earth’s fuel profit by reworking the funnel.
First, we added a skincare quiz to attract new customers. Surprisingly, the quiz lowered CAC while simultaneously increasing LTV.

Next, we compared which products and offers led to the highest retention rates.
To our surprise again, Bambu Earth’s mini-kits (while generating lower initial AOV) led to significantly higher LTV. Perhaps most striking, we found that customers who used discount codes on their first purchases were actually more valuable to us than their full-price counterparts.
Finally, we invested heavily in personalized email marketing both to new subscribers and especially to existing customers.
The result?

Last month (Jan.), Bambu Earth generated $742k in sales at 20% net profit — a mere $150k less than both Nov. and Dec. of 2020 combined.
Even better, it did that at a lower ROAS than when were ready to shut the whole thing down.

Sounds a lot more like winning, right?
Winning with Your Ecommerce Business Model 📊 LTV:CAC Ratio
All told, unit economics can be heady work.
Most ecommerce businesses have a ton of products to analyze before arriving at their final numbers. Plus, factoring in LTV adds an entirely new layer of complexity.
To make winning easier, we’ve developed Statlas for tracking client data as well as our own brands (like, Bambu Earth; show below).

Sometimes, curiosity prompts you to examine every moving part. Sometimes, necessity.
To quench that curiosity while discovering ways to maximize the inputs, download the Unit Economics & Fuel Profit Calculator.
Having steady revenue is no longer the standard.
With unit economics, you can beat the “revenue rich, profit poor” struggle and gain a true understanding of how to generate more dollars in your pocket
We won't send spam. Unsubscribe at any time.


