
Why ROAS Is a Terrible Metric and Three That Actually Matter:
The ‘Gift’ of iOS 14

by Ally Simms & Luke Austin
Feb. 03 2022
Maybe the writing was always on the wall. Given the data leaks and privacy scandals, we probably should have seen it coming.
Deep down we knew … but chose to ignore it.
Early last year, when Apple’s update required users to choose if they’d like their data collected by third-party applications, 96% opted out.
And Facebook ROAS tanked by roughly 30% overnight.
Needless to say, iOS 14 rocked ecommerce to its core.

What if iOS 14 was a gift in disguise?
Hear us out.
iOS 14 was a rude awakening that many of us weren’t measuring the full efficacy of our ad spend. We got soft, complacent even, reliant on a number that hid the truth in plain sight.
However, amid confusion and fear, we were forced to ask three questions we should have been asking all along …
As simple as they sound, these questions reveal more about ecommerce success than ROAS ever could.
Even better, they’ll enable you to place three metrics that truly matter at the center of your business’ growth.

‘Are Your Ads Actually Working?’
1. Google Analytics ROAS & Weighted CAC
It’s impossible to overstate the confusion iOS threw over the DTC world. No one, not even Facebook, knew if the sudden plummet in ROAS was real, a reporting issue, or some combination of the two.
Unfortunately, many businesses and agencies took it at face value. Across the ~250 ecommerce brands we monitor through Statlas — less than half of which are CTC clients — spend deceased by 23% comparing the three months before versus after iOS 14.5’s full rollout.
To know if performance or attribution was at stake, we chose two metrics unaffected by Facebook tracking:
Google Analytics last-click depends solely on disciplined UTMs and “channel” grouping. It doesn’t take into account “view” attribution; so it’ll always be lower than Facebook ROAS. But that’s exactly the point.
Historical data showed Google Analytics was not impacted to the same degree as Facebook.
For example, here’s what we found for one of our fashion accessories clients:

Of course, that’s not necessarily true for your business …
Client by client we combed through the numbers.
Below you’ll find four different brands (two of which we own and operate) showing the relationship between Facebook ROAS and Google Analytics last click.
Unlike the table and graphic above, these plot the entire year. They also include correlation coefficients (r) used to determine how reliable Google Analytics was in setting new Facebook targets.


In other words, that 30% plummet? Scary. But not necessarily reality.
With some, we went as far back as three years to translate Google Analytics ROAS into Facebook ROAS targets.
How? By benchmarking the relationship between pre versus post.
If historically Google Analytics reported ROAS at ~50% of Facebook, then jumped to ~80% after iOS’s release … that meant our new Facebook target would be 80% of the original — from 1.50 to 0.88.


For your own business, it’s far from ‘too late’ to do this analysis.
There is one fatal flaw to using only Google Analytics as an index for your advertising results; it only gives credit to the highest-performing last-click campaigns.
If someone doesn’t buy after clicking a prospecting ad, but buys within seven days after clicking a remarketing ad, Google Analytics will only give “credit” to the remarketing ad.

Follow that to its (il)logical conclusion and you’ll over-dedicate funds to bottom-funnel campaigns and sacrifice top-funnel campaigns that are doing the heavy lifting.
This is why understanding your weighted CAC is equally crucial.
Thankfully, this one is a lot more simple and doesn’t depend on disciplined UTMs nor tight “channel” grouping.
Calculating your weighted CAC is as easy as dividing your total ad spend by the number of new customers acquired.

CAC clarifies how efficiently your business needs to acquire customers as well as the current efficacy of your top-of-funnel campaigns based on Shopify data.
Together, Google Analytics and weighted CAC can confirm whether your ads are working or not in a post-iOS-14 world.
‘Are You Really Making Money?’
2. Marketing Efficiency Rating (MER) or ACOS
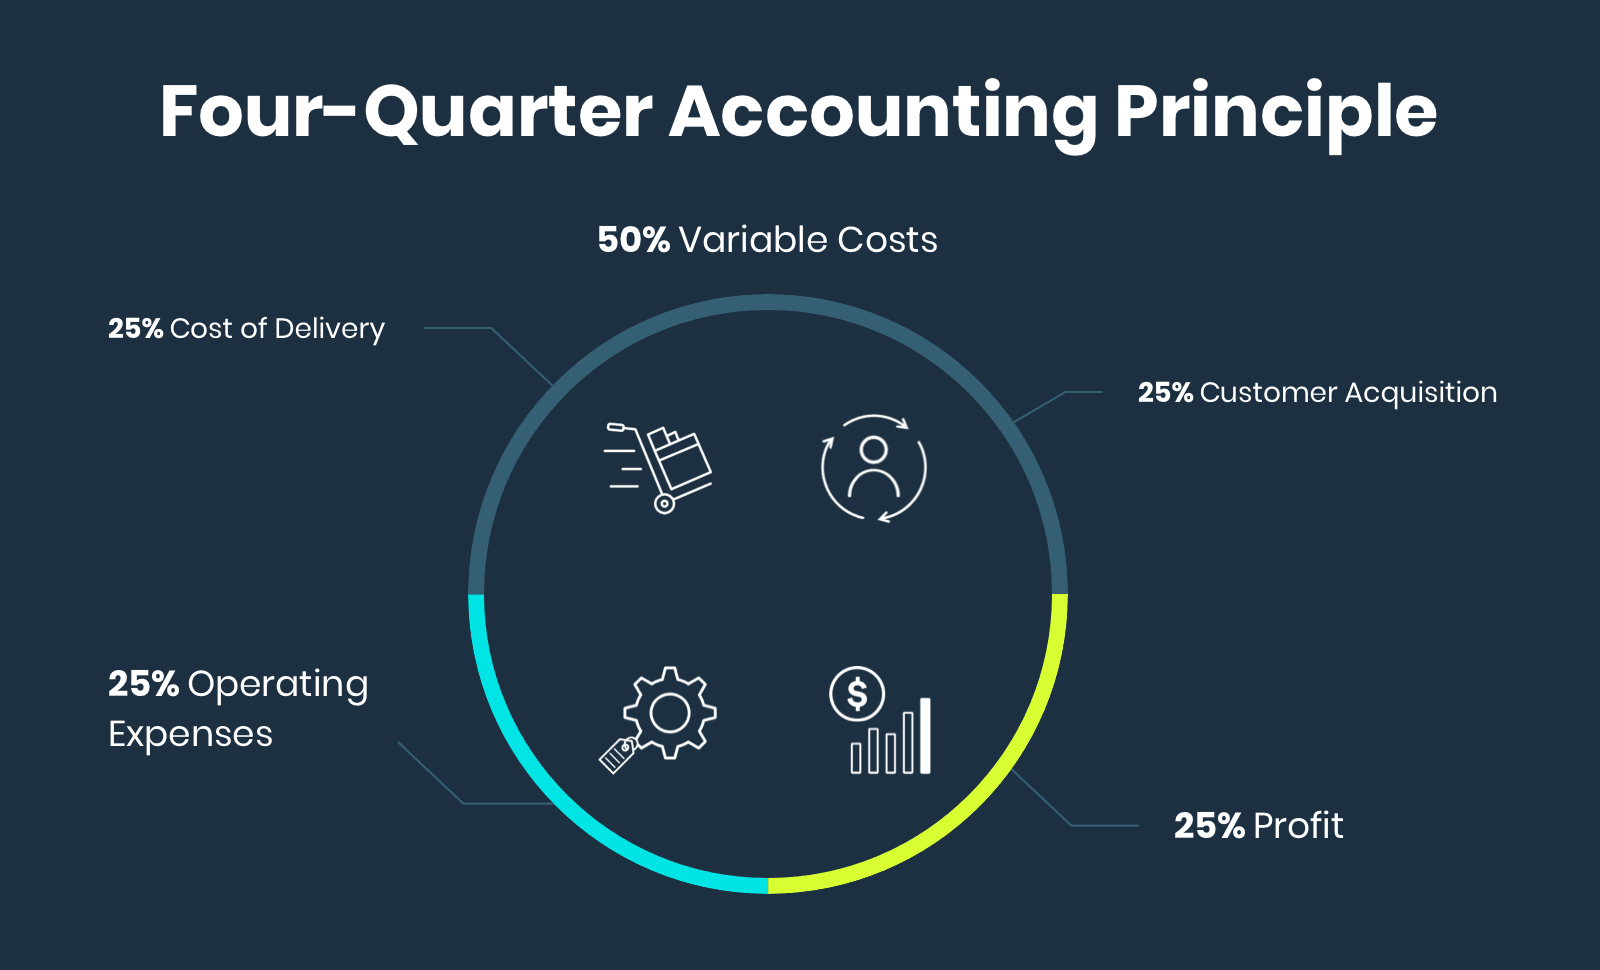
To know if we’re really making money, we start with a straightforward way to examine your P&L — four-quarter accounting.
Ideally, 25% of revenue goes into each of these four buckets:
- 25% cost of delivery
- 25% customer acquisition
- 25% operating expenses
- Leaving 25% for profit
While not exact, these 25% allocations give us something to strive toward.
Looking at this answers, “How much can I spend to acquire customers and remain profitable?”
When one bucket increases, another decreases. If they’re not balanced, what can you adjust to increase profit and decrease cost?
Once we’ve backed into four balanced buckets, we can look at:
Marketing efficiency rating (MER)
Total revenue ÷ total ad spend
Advertising cost of sales
Total ad spend ÷ total revenue

The two are essentially inversions: MER (sometimes called “blended ROAS”) measures the overall effectiveness of paid media; ACOS represents paid spend as a percentage of total revenue.
Both metrics sit inside the upper right quarter: customer acquisition.

You have to have a crystal clear view of your business financials if you want to get your Advertising Cost of Sales (ACOS).
Once you’ve dug through your P&L and understand all the different factors at play, you can adjust your ad spend to hit your cost and customer acquisition targets.
You can also use your ACOS to make practical daily advertising decisions.
Historically, one of our clients had a Facebook ROAS of 2.25 while their ACOS ratio target was 23%. Pay special attention to the high ROAS on Sept. 3rd.

What appears to be scalable based on Facebook ROAS isn’t sustainable for the business itself.
If we were making decisions based on ROAS alone, we’d push into the first three days of the month: an average of 3.56 is far above their historical average of 2.25.
When we look at ACOS — which is indicative of the bigger financial picture — we quickly realize that these ads aren’t laddering up to our client’s profitability target.
Aiming for better single-channel ROAS makes it easy to forget the real goal is to unlock growth.
This is why scrutinizing ACOS, MER, and four-quarter accounting should guide profitability, scalability, and long-term success.
‘Are You Selling the Right Products?’
3. 60-Day LTV:CAC … Oh, and Profit (Again)
It’s not uncommon for companies to talk about their two-year or even five-year lifetime customer value.
But if you sit around waiting for five years to achieve that lifetime value, it’ll create cash-flow constraints, production problems, and scalability issues.
This is why we examine our LTV:CAC ratio within 60-day windows.
Using the retention rule of 30:100, we aim for a 30% increase in LTV over the first 60 days and a 100% increase in 12 months.
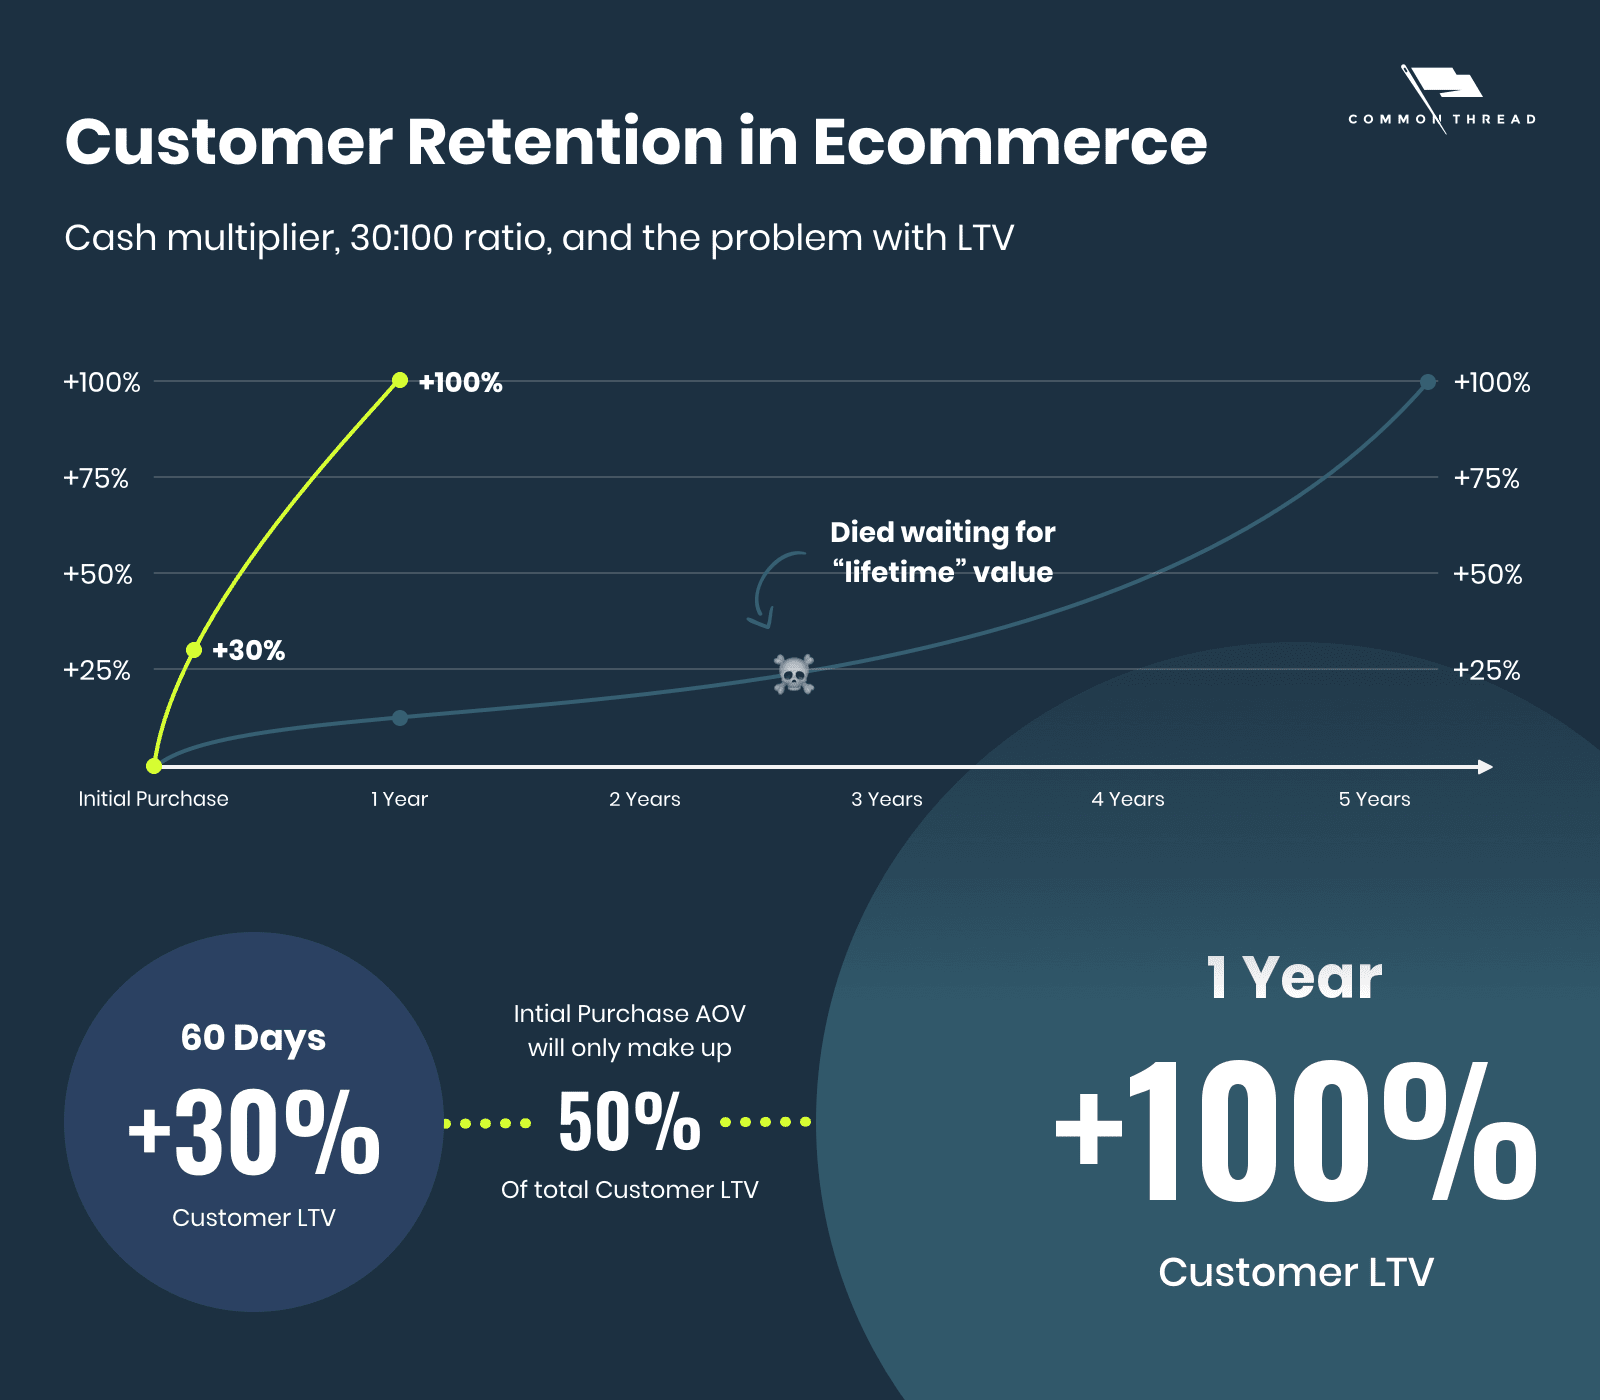
This defines LTV within actionable timeframes, allowing you to accelerate incremental revenue rather than die waiting a “lifetime.”
We pay close attention to both windows inside all of our client’s accounts as well the brands we own and operate.
For an antifragile business like Bambu Earth you can see the benefits for yourself …

A “cash multiplier” of $124 means $40 in additional revenue over first purchase AOV. That’s a 60-day LTV of +47.5% and one-year of +108% (or, $175). Predictable increases in LTV enables Bambu Earth to grow profitably even at a <1.0 ROAS.
However, we can still improve these metrics by examining cohorts of customers by first product purchased and see which SKUs create the highest 60-day LTV.

Crazy, right?
Add in AOV and the picture is even more interesting.

Not only is the 60-day LTV impacted by the first product a customer purchases, but so too is the average order value over the lifetime of that customer.
This data is what begs the question: Are you selling the right products?
To answer that, we need to back into our CAC targets by looking at the specific behavior based on the customer’s first-touch purchase.
You can see how we did this by organizing LTV and CAC data by SKU.

From there, we indexed our ad spend with accurate expectations by considering both the cost to acquire a customer as well as the expected lifetime value.
This moves us closer to a LTV:CAC ratio tailored to the business — and yours.
But that’s still not the complete picture; we need to consider profit.
If we take the same analysis as before and layer in product costs and Facebook spend per SKU, we can see the expected profit we’ll produce per customer over a 60-day, 90-day, and 180-day window.

With that, you can determine which products to invest in and how much to expect back.
ROAS Isn’t ‘Dead’ … But There is a Better Way
That’s why iOS 14 was a gift.
For years, ROAS alone gave us shallow information and allowed us to avoid asking more meaningful questions.
Clearly, answering them isn’t a walk in the park. These questions may force you to clean and clarify your financial and marketing data in a way you’ve never done before.
Nonetheless, iOS 14 is giving us the opportunity to look deeper at our businesses and if you use these metrics, you can unlock profitable growth in a way that wouldn't have been possible in the past.
If you need help or have questions … do not hesitate to download the full guide, write back to us via email, or reach out directly on social media.
Our links are immediately below. And we’re here to help!
We won't send spam. Unsubscribe at any time.


Luke Austin is SVP of Strategy at Common Thread Collective, where he leads strategy and client delivery across their portfolio of ecommerce brands. Working across billions in GMV, he turns growth patterns into the systems and teams that give operators the leverage to produce profitable growth.