
Marketing Efficiency Ratio (MER) & Ecommerce: How to Hold Every Ad Dollar Accountable for Profit

by Dave Rekuc
Mar. 29 2022
What is marketing efficiency ratio (MER)?
Marketing efficiency ratio measures the overall performance of your digital marketing efforts: Total revenue divided by total spend.
Also known as marketing efficiency rating, media efficiency ratio, blended ROAS, or “ecosystem” ROAS, MER is a North Star metric. It isn’t meant to guide media-buying decisions at the ad or campaign level. Instead, it helps you understand marketing costs as a multiplier of revenue generation.
For example, if you spend $1,000 across paid channels and generate $3,000 in total sales ... MER would be 3.0 — or, 3x spend.
It’s a question every ecommerce brand asks. One that lies at the heart of your marketing strategy. Not to mention your business itself.
And, it’s the wrong question.
“How much can we spend on advertising?”
Some get closer by adding an important qualifier, “How much can we spend on advertising and still make money?”
The real question is …
“When does my next dollar of advertising stop making me money?”
Naturally, the keyword is “next” — which means we’re talking about marginal increases in costs, customers, and money (you know, profit). Underspend and you’ll leave money on the table. Overspend and you’ll burn right through breakeven.
Thankfully, there’s a logical way to arrive at your ideal ad spend.
It’s called marketing efficiency ratio. Or, to be precise, acquisition marketing efficiency rating.
To pinpoint these coveted metrics and hold every ad dollar accountable for profit, we’ll follow three steps …
- Defining MER & Separating New Customers
- Calculating aMER & Comparing Blended vs Marginal
- Finding Your Breakeven Point & Targeting Your Ideal Ad Spend

Marketing Efficiency Ratio (MER): Defining & Separating
Marketing efficiency rating exists to measure every ad dollar out against every revenue dollar in. It answers the big-picture question: How much did we make based on how much we spent?
The calculation is simple. Total revenue divided by total ad spend.

Similar to ROAS, MER is expressed as a ratio. $15k in revenue on $5k in spend equals an MER of 3.0.
Whether you’re driving visitors to your website via Facebook and Google Shopping — or, generating sales on Amazon — the money spent on advertising affects revenue on a daily basis.
Of course, so do other factors.
It doesn’t cost much to send marketing emails. When an ecommerce campaign or flow performs well, it drives revenue without driving spend.
That’s good. The bigger the gap between revenue and spend, the higher your MER, the more you should pour into paid ad campaigns.
But it’s also murky. Especially attribution in a post-iOS-14 world where everything — from CPM to CPA on Facebook ads straight across to all the other social-media marketing channels — has become increasingly difficult to track.
Here, though, the key point surrounds purchasers themselves.
Email generates revenue from existing customers. Ad spend, from new. To get clarity, we need to isolate the two.
Separating Retained vs New Customer Revenue
Revenue from retained customers should have little association with ad spend — outside of paying the Google tax a la brand terms.
The goal is to maximize retained revenue without overspending and without compromising future pricing power by running deep discounts.
Determining ideal spend on acquired customer revenue is trickier.
Unlike retained customers, you aren’t just mitigating costs. Rather, ad costs are a significant part of acquiring a customer.
Since this is where the lion’s share of spend goes, it’s the most important part of the MER equation — making sure that each new dollar you spend on acquisition is profitable.
Customer Acquisition (aMER): Calculating & Comparing
Acquisition marketing efficiency rating (aMER) is calculated by dividing new customer revenue by total ad spend.
No ecommerce or advertising platform will give you this number natively. At 4x400 — the DTC holding company owned by Common Thread Collective — we report on both MER and aMER day by day.

We automate this process through Statlas (screenshot above).
But you can crunch it for yourself by examining new-customer, first-time orders via Shopify:

Not surprising, there’s a tradeoff between volume and efficiency. A linear reduction in aMER for every additional $10k in spend would look like this …

However, the data hides an important caveat; it’s only showing us the mean average of the total ad spend.
We call this blended aMER.
See how the waters are getting muddier? We need to break this number down further to understand the marginal impact of new ad dollars.
Understanding Marginal aMER
Marginal aMER measures the relative performance of each additional ad dollar. Here, we’re getting close the foundational question.
For the same dataset, rather than looking at total spend and examining its efficiency — blended aMER (green line) — we’ll add the marginal aMER per $10,000 of new spend (blue bars):
- Blended aMER = Total acquired revenue ÷ Total ad spend
- Marginal aMER = Marginal acquired revenue ÷ Marginal ad spend

Notice marginal aMER drops faster than blended MER. Why? Because as efficiency decreases every new dollar spend produces less dollars earned.
Comparing that difference is the crux of this entire operation.
Ideal Ad Spend: Finding Your Breakeven Point
Uncovering marginal aMER gives us the tools we need to finally answer our central question:
“When does my next dollar of advertising stop making me money?”
Herein lies the gold. The last remaining input is your breakeven point. At 70% gross margins, that’d be a 1.5 marginal aMER and a blended aMER of 2.0. Need help defining or calculating gross margins? Then, jump over to our guide on ecommerce unit economics.
This time, I want to show you both the sample data as well as the chart. Note, I’ve bolded the breakeven point.


With blended aMER alone, you might set your budget as high as $110k per month. And yet, spend after $60k only loses money.
Charting contribution margin (CM) for each cohort of $10k spend illustrates this vividly.
Contribution margin is total revenue minus the full cost of producing and delivering the item. When marginal CM slips below $0, it’s no longer “profit producing ad spend.”
This is the same data as above assuming 70% gross margins.
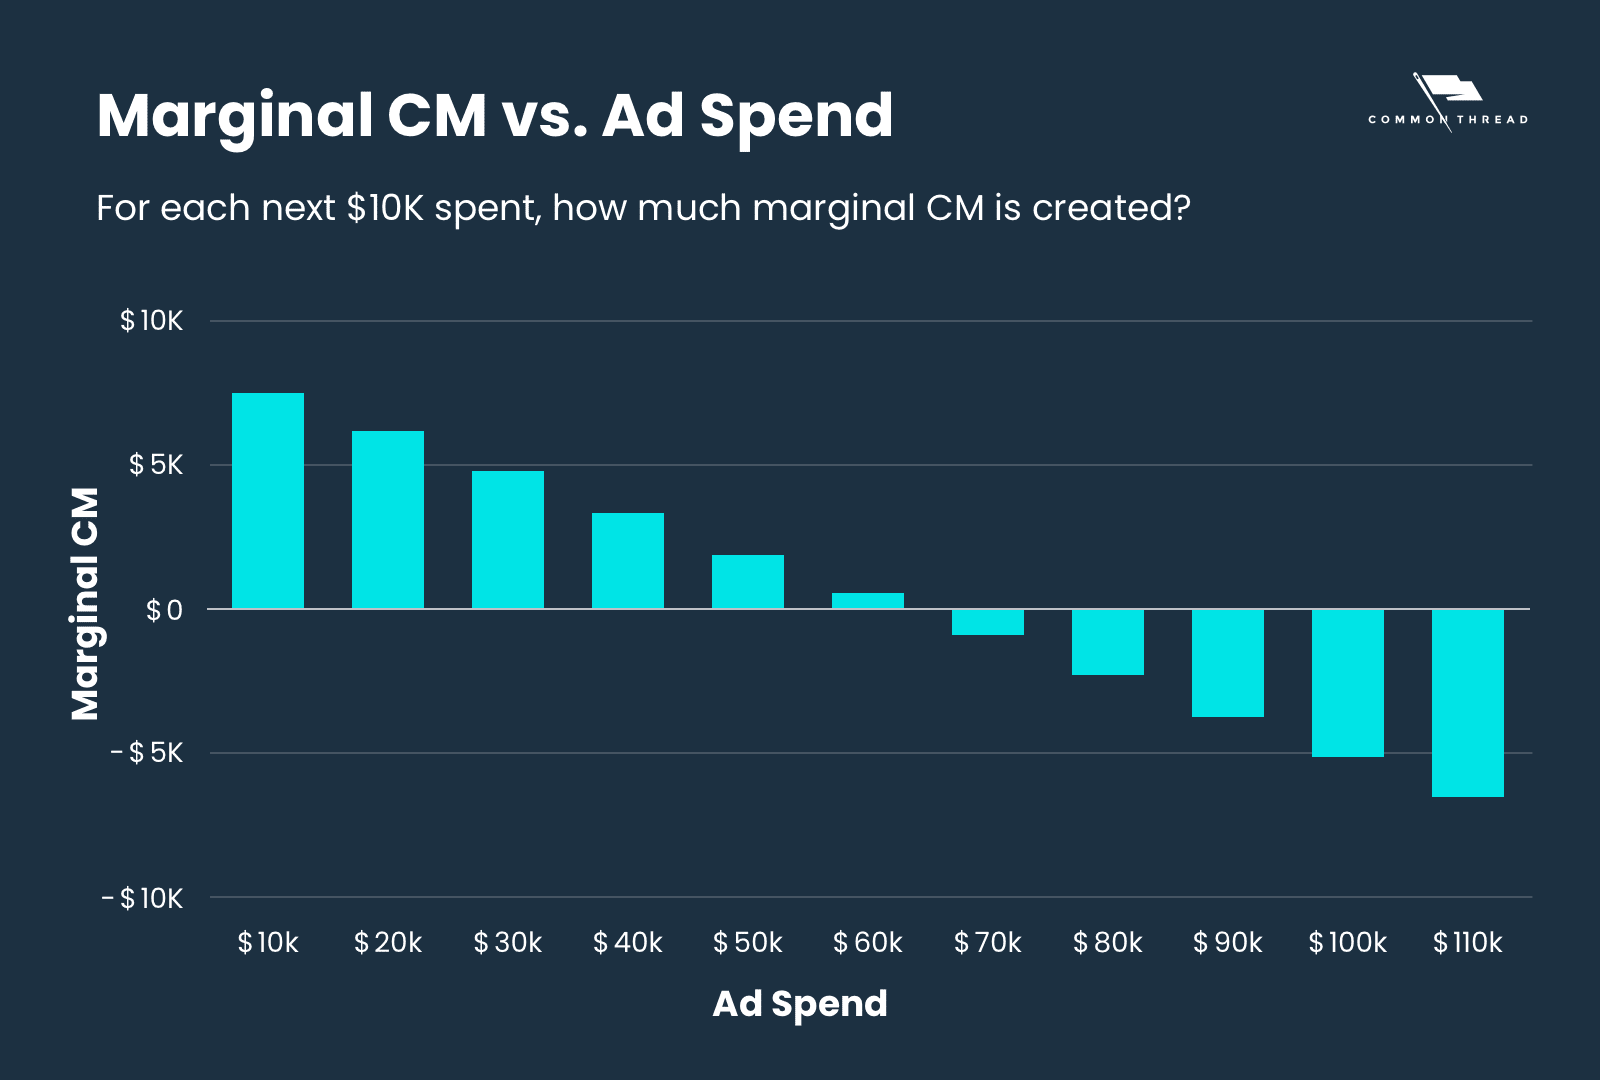
Let me repeat, any spend after $60k loses you money despite the blended aMER looking like it’s above the profitability threshold. As Taylor Holiday puts it: “Volume only helps you cover OpEx if it produces margin.”
In the real world, you’re unlikely to get a perfectly linear decline in performance.
To illustrate further, let’s look at a nonlinear reduction of aMER where early spend increases don’t affect efficiency early on, then taper off quickly …
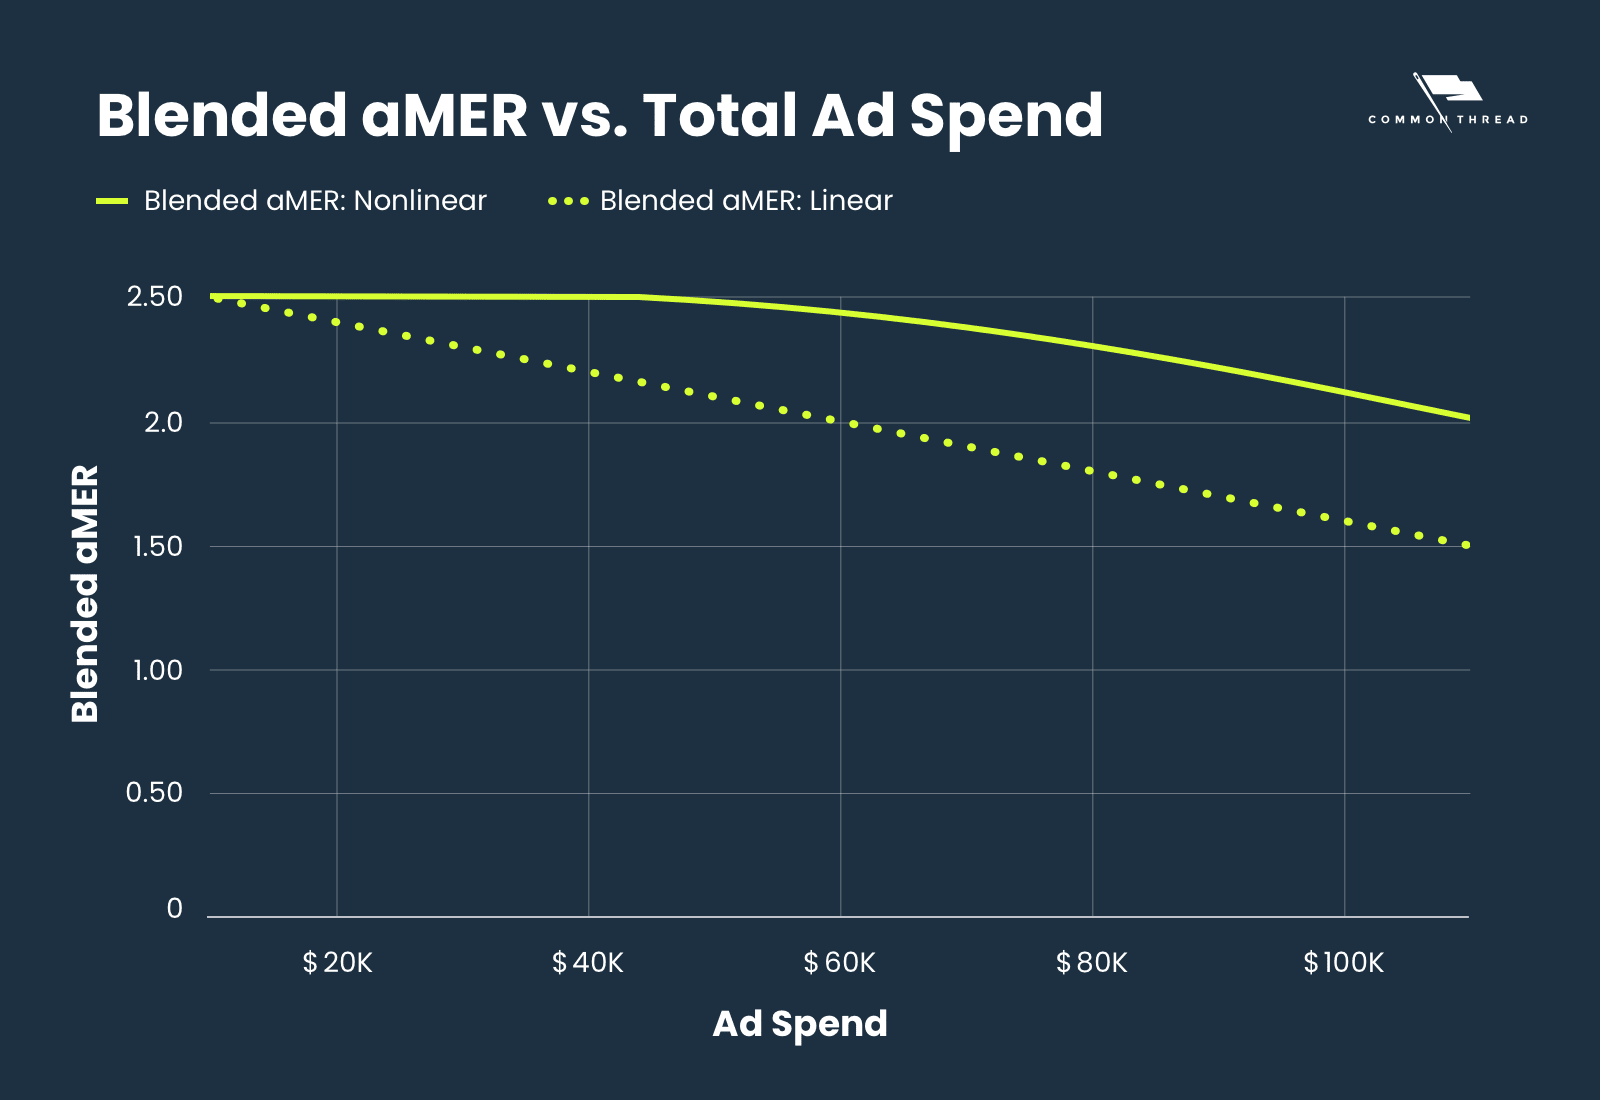
As blended aMER changes, so does marginal aMER, marginal CM, and (most importantly) the breakeven point.
Again, here’s both the data and the chart.

It’s way too easy to mistake the green line for above breakeven when, in reality, marginal aMER becomes unprofitable fast.
To summarize …
Our ideal spend in the first (linear) sample dataset is $60k a month which worked out to a 2.0 blended aMER. In the second (nonlinear) set, the ideal spend is $80k a month and works out to a 2.3 blended aMER.

The point isn’t linear versus nonlinear. It’s that aMER dramatically affects when more spend stops making you more money even when gross margin and spend increases are identical.
In practical terms, there are two takeaways:
-
Blended will always trail marginal.
Translation: Your marginal aMER will become unprofitable before your blended aMER.
-
You’ll never know the marginal aMER for every cohort of spend.
You can, however, sample two points and look at the delta between them. If you increase spend from $1k per day to $1.5k, focus on the marginal aMER of that $500 increase.
By calculating marginal aMER between two spend points — A versus B — you’re working through the right exercise.
So, let’s do the right exercise …
Along with all the data and charts you’ve already seen, inside the Marginal Return on Ad Spend Calculator is a (well) calculator.
You can certainly play around with the more complex tabs and tables, but the calculator only requires three inputs:
- Your Average Gross Margins
- Total Ad Spend & Acquired Revenue A
- Total Ad Spend & Acquired Revenue B
There’s also a short video I put together to walk you through exactly what to enter for A versus B and how those inputs can help you hold every ad dollar accountable for profit.
Setting Ideal MER Targets
There is no way you could have known in advance where ideal aMER would land in the previous examples.
Instead of asking, “What ad spend should I run my store at?” reframe the question to:
“When does my next ad dollar stop producing contribution margin?”
You’ve seen how setting an arbitrary aMER can lead you astray. The same holds true with MER. Maximize repeat revenue and optimize acquired revenue to be profitable for each new dollar spent.
The resulting MER is your ideal MER.
I won’t mince words. Nothing I’ve outlined is particularly easy.
Still, arriving at an MER you build from the ground up is the only way to ensure you reach an optimal ratio for profit.
Your ad platform doesn’t exactly tell you what the returns are on the next $10k you spend.
Only by deconstructing and evaluating your metrics will the answers to all your marketing spend questions will be revealed.
How Does Cash Flow & LTV Factor Into MER?
Using aMER, we’ve created a structure that maximizes profitability on your customer’s first purchase. What if your brand has significant customer lifetime value (LTV), shouldn’t you be maximizing ad spend based on LTV not just first purchase?
In a recent Twitter thread, I broke down how businesses can determine an optimal amount of LTV for their ad spend based on several factors.
A thread on the practical applications of CLV and some of the misconceptions around the metric.
— David Rekuc (@DaveRekuc) January 4, 2022
First, when marketers reference CLV, they're often actually talking about CLR (customer lifetime revenue).
Let’s assume you go through this exercise as an operator and determine optimizing for a 60-day LTV is ideal for your business. How do you apply this knowledge of marginal returns to ad spend?
It’s actually quite simple. When you’re optimizing for first purchase your formula for aMER looks like this:
New customer revenue ÷ ad spend = aMER

Rather than aMER, we instead want to use a similar formula that includes the value of the customer over the following 60 days. Let’s call that 60-day PAR (which stands for post-acquisition revenue).
Our new formula is:
(New customer revenue + 60-day PAR) ÷ ad spend = 60-day aMER

Plug in this 60-day aMER anywhere we previously used aMER and optimize for the point when your ad dollar stop producing contribution margin.
Optimize Ad Spend with Marketing Efficiency Ratio, Then ROAS
Still not convinced it’s worth figuring out your business’ ideal MER? I’ll leave you with a few metaphors …
The first comes from Taylor Holiday. He equates revenue to giving someone $20; they give you back $10. You do this thousands of times. And you call that revenue.
This is what happens in many cases with media spend. We exchange dollars for less dollars back, call it revenue, and act like it’s good business.
My story goes like this: There’s a robot in a store blindly agreeing to whatever price a customer offers for a product that costs $20. So, customer one comes in and gives you $50. You made $30. Each customer comes in and offers less and less for the product. Throughout the day, it hits a point where the next customer comes in, offers you $19 and you still sell it.
At the end of the day, you made 10% on sales. But we know that it would be better if you cut off those customers at the point where they stopped handing you over $20 per order.
This is what happens when we use means and averages, rather than looking at individual parts.
Both stories serve to show us the flaws in our current understanding of ad spend and revenue. And both problems are solved by using MER.
Now you’ve got everything you need to answer the biggest question in ecommerce marketing:
“When does my next dollar of advertising stop making me money?”
Get your numbers together, download the Marginal Returns on Ad Spend Calculator, and cozy up with my explainer video.
It’s time to find your ideal MER.
We won't send spam. Unsubscribe at any time.