
Managing your Facebook account can be exhausting.
Especially when you’re caught up chasing daily outcomes: tweaking budgets, building new audiences, constantly turning ads on and off.
For most entrepreneurs, CMOs, and media buyers, Facebook Ads is an opaque, cumbersome process that keeps you hanging on with the vague promise of “massive scale.”
Achieving scale is possible. How? By shaping your strategy around three principles:
- High-floor: Leverage Facebook’s machine learning to minimize human error, optimize spend, and reduce management busywork.
- High-ceiling: Focus on the human levers that unlock major growth — ad creative and offer testing to engage new customers.
- High-profit: Structure your account around your business’ overall profitability, not the ROI of a single channel
After half a billion in revenue across hundreds of clients, our foundation is the exact 27-point Facebook audit this article contains.
We’ve divided the audit into five sections, to make jumping to your needs or level of expertise easy (just click the numbered links below). Throughout, you’ll see high-floor, high-ceiling, high-profit called out in bold.
Even better, we’ve made the full checklist available as Google Slides you can copy and use for yourself … plus, recorded a nearly one hour video walkthrough!
- Basics: Pixel, Conversion API & Configuration
- Account Structure: Budgeting, Learning & Scaling
- Targeting: Audiences, Exclusions & Going Global
- Performance: Optimizing Ads & Campaigns for Purchase
- Ad Creative & Ad Types: Testing, Testing & More Testing

To make this as practical as possible, let’s go behind the scenes …
Every question, step, and example you’re about to experience comes from Bambu Earth — a clean-beauty skincare brand Common Thread Collective owns and operates.

When we acquired the business in March 2019, it was generating ~$10k a month. Today, that number is well above $500k.
While the full story includes accelerating customer lifetime value (LTV) and majoring on customer retention, Facebook advertising was and is our primary new customer channel.
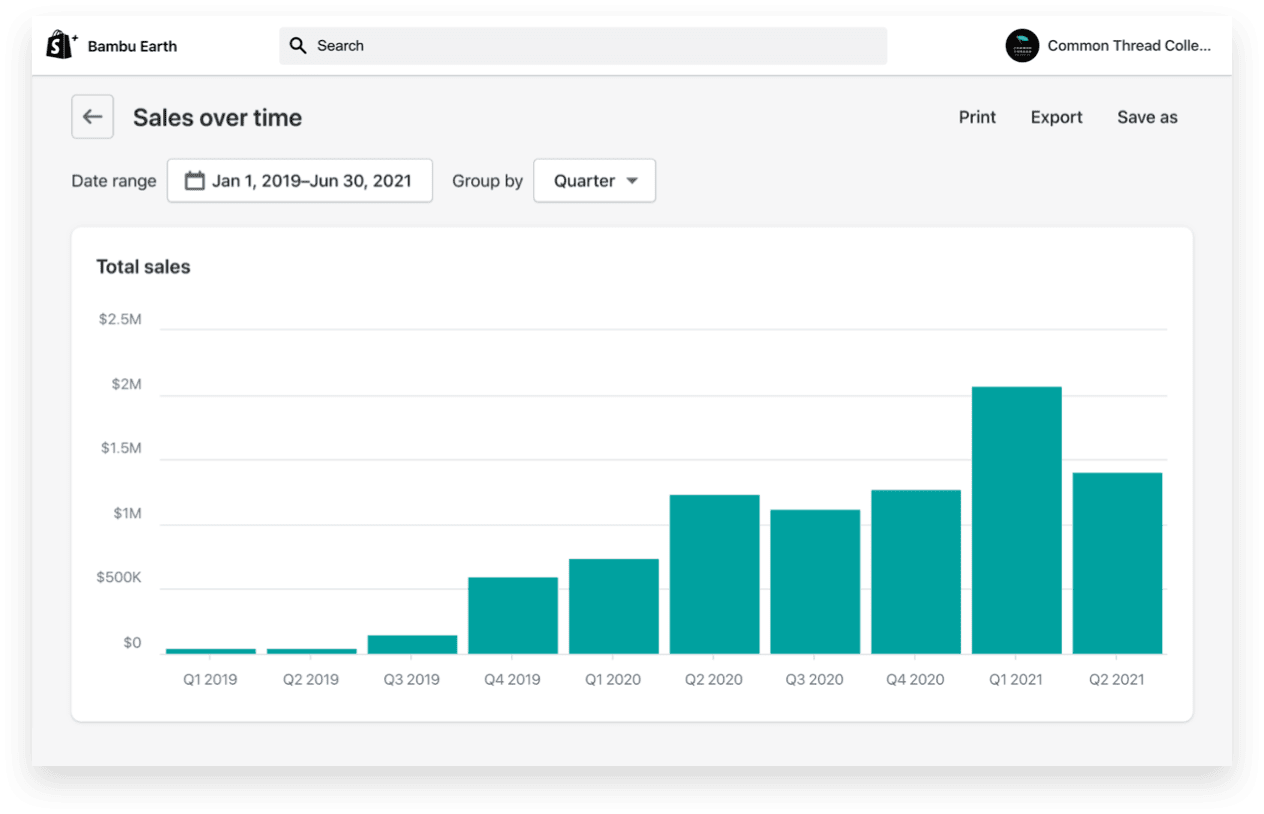
Alongside best-selling individual products, a personalized Skin Quiz and its accompanying Starter Kits dominate the ad account.
And yet, no account is perfect.
Which is great news because that means you’ll get to learn on our dime: the good, the bad, and (yeah) even the ugly!
Facebook Ads Account Audit Set-Up: Pixel, Conversion API & Configuration
1. Is the Pixel Installed and Firing Correctly?
It sounds basic. But that’s the essence of high-floor thinking, mastering the basics and eliminating unforced errors.
When your Facebook Pixel isn’t firing correctly, you’re essentially flying blind — more-so now that iOS14 has changed so much within Facebook Ad Manager.
You’ll need to answer three questions:
First, is your pixel recording multiple purchase events? To check, go into Events Manager > Data Sources > Pixels. There you’ll be able to see if multiple events are firing at the same time.
![]()
Second, is your domain verified? This is a new requirement due to iOS 14. And it must be completed by the account owner. That’s why we’ve made step-by-step instructions along with a video here.
Third, have you selected the right Web Events in Facebook’s Aggregated Events Manager? For users that opt out of Apple’s ATT Prompt, Facebook will only track the “Highest priority” event.
Allocate at least the first four to “Purchases.” Set the remaining events to “Initiate Checkout,” “Add to Cart,” and “View Content.” If you track “Add Payment Info,” prioritize it immediately after “Purchases.”

Bonus set-up question: Has Facebook’s Conversion API (CAPI) been integrated with your Shopify store? This one is anything but “basic,” so we’ve created screenshot-heavy Facebook CAPI instructions, including what it is and how it can help.
2. Is the Commerce Manager Configured for Ecommerce?
You’ll find the Commerce Manager in the “All Tools” hamburger menu:

Formerly known as the Catalog Manager, this is where you sync data sources like Shopify. It automatically pulls in products, images, prices, descriptions, etc., allowing you to run Dynamic Product Ads (DPAs), in-app Facebook and Instagram Shops, as well as create Sets to bundle products:

To check the Commerce Manager configuration, start by searching for your account in Catalogs and click Data Sources. This will tell you if your catalog is pulling from the correct place.

Daily syncing is needed to prevent sold-out items from appearing in ads. So, don’t forget to check if the date is current.

Customize columns …
To self-administer the rest of this audit, you’ll need to create the following custom metrics:
- 3-SEC VV/IMP = 3-Second Video Plays ÷ Impressions
- Conversion Rate = Purchases ÷ Outbound Clicks
- AOV = Purchases Conversion Value ÷ Purchases
Select “Customize Columns…” from the Columns menu:

Click “Create Custom Metric…” at the top of the Columns view:

From there, build your custom metrics by typing the names of existing metrics in the dialog box:

Once you’ve made those three, order your columns:
- Delivery
- Attribution Setting
- Date Created
- Bid Strategy
- Budget
- Amount Spent
- Purchases
- Purchase ROAS
- Purchases Con. Value
- Cost per Purchase
- Adds to Cart
- Cost per Add to Cart
- Outbound Clicks
- Outbound CTR
- Cost per Out. Click
- CPM
- Reach
- Impressions
- 3-Second Video Plays
- 3-SEC VV/IMP
- Video Avg. Play Time
- Conversion Rate
- AOV
- Frequency
Don’t do this manually!
It’ll take forever, and we’ve got a shortcut.

Copy and paste the following sting after your business_id= in Facebook’s Ad Manager campaign-view URL:
&columns=name%2Cdelivery%2Ccampaign_name%2Cbid%2Cbudget%2Cspend%2Caction_values%3Aomni_purchase%2Cpurchase_roas%3Aomni_purchase%2Cactions%3Aomni_purchase%2Ccost_per_action_type%3Aomni_purchase%2Cunique_actions%3Aomni_initiated_checkout%2Ccost_per_action_type%3Aomni_initiated_checkout%2Cunique_actions%3Aomni_add_to_cart%2Ccost_per_unique_action_type%3Aomni_add_to_cart%2Coutbound_clicks%3Aoutbound_click%2Ccost_per_outbound_click%3Aoutbound_click%2Coutbound_clicks_ctr%3Aoutbound_click%2Ccpm%2Creach%2Cimpressions%2Cquality_score_ectr%2Cquality_score_organic%2Cquality_score_ecvr&attribution_windows=default&date=2019-11-29_2019-11-30%2Ctoday&selected_campaign_ids=23844010769630634&sort=spend~0And voila! Your columns are ready to go. Simply select “Save” from the “Columns” drop down and you’re set.

Facebook Ad Account Structure: Budgeting, Learning & Scaling
3. Is the Account Using Campaign Budget Optimization (CBO)?
Campaign budget optimization (CBO) manages your Facebook budgets at the campaign level, optimizing spend across ad sets to get you the best results.
For example, the daily campaign budget below is set at $500. With CBO, Facebook allocates that $500 to whichever ad set it determines is going to generate the most conversions.

It’s another element of the high-floor approach. Because Facebook’s algorithm can process more data more quickly than a human, it’s better at making decisions about spend allocation.
Although it’s both CTC’s and Facebook’s best practice to use CBO, in some cases, Ad Set Budget Optimization (ABO) is the better option. If you’re doing strict A/B testing, you’ll want to use equal ad spends to get a fair test.

4. Have Cost Caps Been Set to Match Products’ Average Order Value (AOV)?
Cost cap is a bidding strategy that forces Facebook to stay below a certain customer acquisition cost (CAC) when bidding in the ad auction. Click “Edit” at the campaign level and select “Cost cap” from the “Campaign Bid Strategy” dropdown.
Set your cost caps based on your AOV and desired ROAS.
If your AOV for a particular campaign is $94 and you want a 2.0 ROAS, you’ll need to set your cost cap at $47. Facebook will keep that campaign’s average CAC at $47, preventing inefficient spend.


5. What Percent of Spend is in the Learning Phase?
Ideally, you want less than 20% of your account in the Learning Phase. Higher than that means Facebook isn’t gathering enough data to fully optimize your spend. Account Overview will report your total; then you can examine individual campaigns.

Once you’ve exited the Learning Phase, Cost Per Acquisition (CPA) will decrease, and your campaign’s Delivery Status will be updated to Active.
The “Learning Limited” warning on an ad set means it isn’t generating enough purchases; below Facebook’s recommended 25-50 conversions per week per ad set.

6. Is the Ratio of Daily Budget to Ad Sets Allocated to Scale?
Speaking of budgets, it’s crucial you avoid allocating too little budget to a campaign relative to CPA as well as crowding too many ad sets within the same campaign.
Either of these mistakes will spread your spend too thin, leaving your ads stuck in the Learning Phase.
The answer? Calculate:
- Daily campaign minimum budget
- Maximum ad sets based on that budget
Minimum Budget

- Determine the current CPA for a given campaign
- Multiply by 50 to get that campaign’s weekly budget
- Divide that number by 7 to yield your minimum daily budget
For the campaign highlighted below, we get the following: (92 x 50)/7 = $657 daily budget.

The current daily spend of $500 per ad set is well below the target. This explains why three of the four ad sets are stuck in “Learning Limited.”

Maximum Number of Ad Sets
- Divide your daily budget by your CPA
- Multiply by seven for your weekly expected conversions
- Divide by 50 for the number of ad sets you can effectively run
Back to the campaign we just referenced: ((657/92) x 7) / 50 = 10 maximum ad sets.
7. Are Dynamic Product Ads Being Used?
Dynamic Product Ads (DPA) pull product images directly from your shop catalog and show them to high-intent, bottom-funnel customers that have already visited your site and browsed those products.
On average, DPAs are the highest-efficiency campaign type, and are crucial to maintaining a high-floor account.
If you’ve followed question two in this guide, you’re ready to set up DPAs by building a campaign with the “Catalog Sales” objective.

Include “DPA” in the name of your campaign. It’ll be much easier to find later!

8. Have SKU-Specific, Full-Funnel Campaigns Been Created?
What we call the “Consolidated Account Structure” has two distinct characteristics:
- Organizing campaigns by SKU or buyer-type
- Combining full-funnel prospecting and remarketing
Organizing Campaigns by SKU
This is the highest-profit way to run evergreen campaigns because it allows you to adjust cost caps and budget in proportion to each product’s AOV.
Take these three best-selling products as a test case. Notice, there’s a huge price difference between the Rosemary Toner at $24 and the Cactus Concentrate at $160:

Let’s say we built a single campaign that drove to a “bestsellers” collection featuring all three of Bambu Earth’s bestsellers. We want a 2.0 ROAS; since AOV would be ~$72, we set our cost caps at $36.
The problem? At a $36 CPA, we’ve told Facebook that we’re willing to accept as low as a 0.66 ROAS on sales of the Rosemary Toner. Even though a $36 CPA could get us a 4.4 ROAS on sales of the Cactus Concentrate, it’s much easier to get a 0.66 ROAS than a 4.4 ROAS.
As a result, Facebook will start favoring ads that result in a lower ROAS because they’ll net more conversions at our target CPA.
However, when you split out campaigns by SKU, proportionate cost caps ensure a high-floor funnel that keeps you on-target without wasting budget.
Combining Full-Funnel Prospecting and Remarketing
Why put prospecting and remarketing in the same campaign? With UTMs, this method allows you to create:
- SKU-specific remarketing audiences from prospecting ads
- Clear customer journey tracking, stage-by-stage
- SKU-specific cost caps at the ad set level
What happens if you create separate prospecting and remarketing campaigns?
Facebook will attribute revenue to the last touchpoint — generally, the remarketing campaign — and you’ll have no clue whether your prospecting campaigns played a role in the purchase journey.
This Bambu Earth campaign demonstrates a healthy campaign structure:
- A broad prospecting ad set
- Two re-engagement ad sets
- Plus, one remarketing ad set
9. Is the Budget — Spend Mix — Set for Efficiency & Growth?
Though spend mix varies depending on your business’ goals, our general recommendation is:
- Prospecting: 60-70%
- Engagement: 5-8%
- Remarketing: 20-30%
- Retargeting existing customers: 5-8%

In this high-ceiling approach, most of your money goes toward acquiring new customers while your remarketing dollars buoy overall account efficiency.
The fastest way to determine where your spend is going is to tighten up your naming conventions. This allows you to filter ad sets by name, giving you a clear view of total spend per audience.
For instance, all we have to do is enter “Ad Set name contains: WCA” (WCA stands for “Website Custom Audiences,” a common remarketing audience) to see that Bambu Earth spent $15,950.42 on remarketing over a 30-day period:

When we clear that filter, we see that total spend roughly $172k:

That means remarketing is roughly 9.3% of total spend — well below the recommended threshold.
Bambu Earth’s low remarketing budget isn’t a mistake. It’s a choice.
The brand’s 60-day LTV is very, very high, which means they can afford to spend most of their paid social budget on new-customer acquisition. It’s an unusual situation based on the unique characteristics of its business.
Facebook Account Audit Targeting: Audiences, Exclusions & Going Global
10. Are Prospecting Audiences Broad Enough to Leverage Facebook’s AI?
The ultimate high-floor tactic …
Do not waste time building multiple ad sets targeted at niche interests. Instead, build broad prospecting audiences and let Facebook find your customers for you.
How wide should you cast your net? The scaling sweet spot is between 10-20 million. At minimum, your audience should be 1-2 million.

11. Are You Utilizing Both Interest Stacks & Lookalike Stacks?
“Stacking” is our term for building multiple interests or lookalikes in the same ad set until we’ve given Facebook a big enough audience to work with.
Here’s an example of an interest stack for Bambu Earth — if we target only “skincare as a field of study,” the audience is a miniscule 1000 people.

As we stack interests, the potential reach increases:
Similarly, lookalike stacking entails running the same ad set to a 1% Lookalike Audience, and a 2% Lookalike Audience, and a 3% Lookalike Audience, etc. … until you’ve built a large enough potential reach.
Consolidating your interest and lookalike audiences lets Facebook test audiences for you, freeing you up to focus on the high-ceiling tactic of building and testing ad creative and messaging.
12. Is Detailed Targeting Expansion Activated?
Detailed targeting expansion gives Facebook permission to use its AI to reach a broader audience if it can’t find performance in your selected Interest or Lookalike audiences.

Enabling “Detailed Targeting Expansion” boosts the potential reach from 12 million to 17 million. Five million more people for Facebook to sift through.
13. Are Exclusions Implemented Properly?
Another critical high-floor tactic, audience exclusions, minimizes how often you pay twice for the same customer. For instance, Bambu Earth is running the highlighted ad set toward a prospecting audience:

To prevent these prospecting ads from delivering to our remarketing audience, we need to exclude them from our prospecting ad set:

Now, our remarketing audience won’t see our prospecting ads, meaning our data is cleaner and we’re not wasting spend.
Use this handy chart to guide you:

14. Have Automatic Placements Been Enabled?
Automatic Placements serve your ad on any platform Facebook chooses, from Instagram to Messenger.
It’s another high-floor, audience-expansion tactic that gives Facebook the broadest possible set of options to consider when making algorithmic decisions.
To opt in, look for the tick-box under “Placements” on the ad set level.

15. Has International Targeting Been Tested?
If your company has the option to ship worldwide, you should test out worldwide funnels.
First things first — make sure you include “International” or “Worldwide” (or some abbreviation thereof) in your campaign names for easy searching and filtering.
Select the locations you want to target on the ad set level:

Specify targeting to those actively living in that country:

Facebook determines which locations perform best and allocates spend accordingly. When you view results broken down by location, you’ll be able to adjust creative to speak to customers in the best-performing country.
Bambu Earth’s locations include multiple English-speaking countries, unleashing Facebook to determine where ads are most likely to succeed.

Facebook Account Audit Performance: Optimizing Ads & Campaigns for Purchase
16. Are Advertising Objectives Set to Conversions?
Although Facebook offers a range of campaign objectives, we tell every client the same thing: Always set your campaign objective to “Conversions.”
Conversions train the pixel to serve your ads to the people who are most likely to buy your product. To easily check for conversion ad sets, toggle “View Setup” and sort by Objective:

The only exception to the “Conversions-only” rule: DPA campaigns, which must be built with the “Catalog Sales” objective.
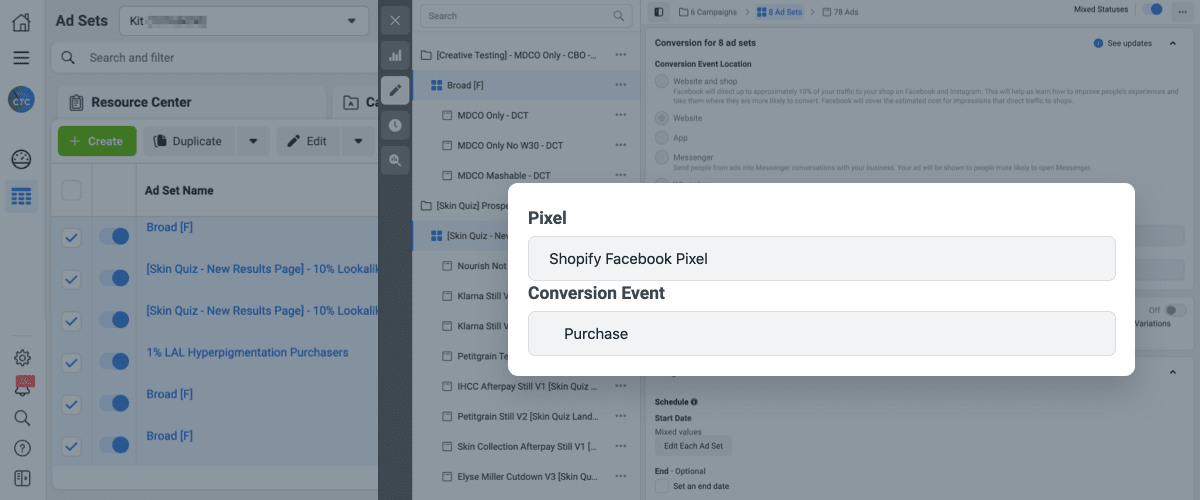
17. Are Conversion Campaigns Optimizing for Purchase?
After you’ve set your campaign objectives to “Conversions,” select the type of conversion: namely, purchases.
If you’re directing Facebook to optimize for other conversion events, like add-to-carts or checkouts initiated, you’re telling the algorithm to look for those behaviors rather than the ultimate action you want to drive.
18. Does Bidding Match Each Ad Set’s Stage of the Funnel?
Generally, you should target a lower ROAS on the prospecting level and a higher ROAS on the remarketing level. That means setting cost caps (i.e., bidding) higher in prospecting and lower in remarketing.

19. What Types of Landing Pages Are Ads Being Run to?
It’s easy to neglect landing pages when you’re caught up in Ads Manager minutiae. In fact, we’ve seen plenty of accounts where every ad runs to the “bestsellers” collection page regardless of the creative.
But a high-ceiling account demands a more thoughtful approach to the ad-to-lander experience.
To check which landing pages you’re running ads to, go to the ad level and toggle “View Setup” on. This answers two questions at a glance:
- Are my ads running to the correct landing pages?
- Which landing pages are converting best?
The first question isn’t just a way of catching careless mistakes. It forces you to step back and consider your ad-to-lander experience more thoughtfully.
Is your ad talking about a specific product but running to a collection page? Are your offer ads running to a homepage that doesn’t adequately message the promotion in the hero? Do you have a clear method of testing landing pages against one another?
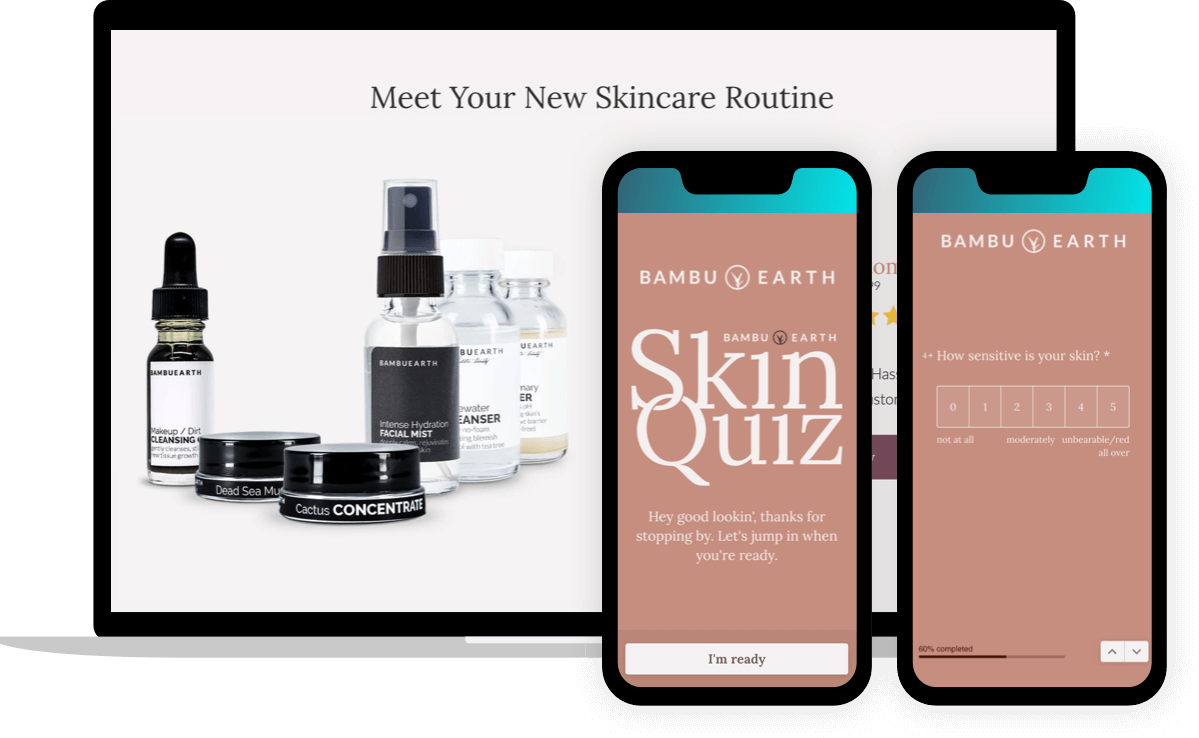
Bambu Earth’s uses unorthodox webpage experiences to drive conversions — most of its best-performing ads lead to an interactive quiz, as opposed to a collection or product page.

20. Is Success Measured by Single-Account ROAS or Profitability?
Most clients come to us with some version of this sentence: “Get me a [x] ROAS on Facebook.”
Judging your entire Facebook account’s performance by a single performance metric almost always causes the same thing:
- More resource put toward squeezing returning customers
- Less resource put toward finding new customers
If your aim is to pump topline revenue ahead of an acquisition, that’s fine.
A high-profit approach demands macro and micro success targets:
- Macro: Does my Facebook success target ladder up to the profitability goals of my entire business?
- Micro: Have I calculated precise targets per ad set that support my overall Facebook target?
For a deep-dive on why single account success targets are so dangerous, watch this video from our CEO Taylor Holiday:
And, to get started calculating high-profit success metrics of your own, check out our Unit Economics Calculator.
21. What are the Historical CPMs, CTRs, and AOV?
Looking back on CPMs (cost per 1,000 impressions), CTRs (click-through rate), and AOVs (average order value) over an extended period reveals chronic issues in your account and potential solutions.
To see what story your data holds, go to the campaign level and look at the last year. In the “Breakdown” dropdown menu, mouse over “By Time” and select your preferred breakdown — month-to-month tends to be the easiest to parse.

Let’s look at two metrics from Bambu Earth that illustrate data storytelling …
First, we see that Bambu Earth’s CPMs began increasing steadily, starting in Aug. of 2020:

We also see, starting in Dec. of 2020, CTR got significantly better and continues to hold steady.

What does it all mean?
We know that the lower CPMs in Q2 of 2020 were due to COVID — a massive advertiser exodus left CPMs at an all-time low.
However, once the ecommerce opportunity presented by COVID became apparent, those advertisers came back — along with thousands of new advertisers ready to take advantage.
The takeaway? CPMs are unpredictable and uncontrollable … so you have to respond with things you can control.
For Bambu Earth, it was increased CTR. While audience targeting can affect this metric, the more likely cause is better, more resonant creative. Notice the cost per click:

Because of that CTR increase, the actual cost of traffic remained stable despite the CPM spike.
Remember, metrics are meaningless in isolation. Examining key metrics as they relate to one another paints a complete picture of what’s happening and what needs to be done in order to hit your goals.
The variable we haven’t covered yet is average order value. To calculate AOV (which Facebook no longer does for you), you’ll need to export your data to Google Sheets or Excel.

Then, use this equation to calculate month-over-month AOV:

We don’t recommend getting AOV from Shopify or your ecommerce platform given that it pulls AOV from across platforms, not just Facebook.
If you’re not hitting your ROAS targets, you’ll need to start methodically troubleshooting, looking for outliers:

Facebook Account Audit Ad Creative & Ad Types: Testing, Testing & More Testing
The hunt for “great ad creative” defies our craving for straightforward, data-based solutions.
Nonetheless, it’s the epitome of high-ceiling thinking: Facebook can’t make good creative for you. You have to let it do the things it can do well so that you’re free to pull the single most important lever you have available to you.
We won’t be able to deep dive into creative here. Fortunately, we’ve already covered social-media ads and creative strategy:

In the meantime, we’ll show you how to determine where your immediate creative opportunities are.
22. Does the Copy Match Each Stage of the Funnel?
Although there’s no exact prescription for what kind of copy you need to run at each stage of the funnel, it’s important to speak to people with various levels of awareness of your product:

Those who are less aware of your product need education about what your product is and what it does. Those who are already aware of your product need direct-sales messaging about why they should buy right now.
Bambu Earth’s full-funnel campaigns use identical copy for prospecting and remarketing audiences:

23. Has the Copy Been Tested, Including Video Captions?
Copy often gets overlooked as a performance variable. Case in point, Bambu Earth isn’t doing any copy testing in this account:

It’s a shame because copy testing is the simplest, fastest way to test offers, value propositions, calls to action — the most important parts of your messaging strategy.
The first piece of copy to test? Video captions.
80% of viewers on Facebook watch ads with no sound on. If you’re running a video ad without captions, you’re essentially wasting spend on an incomprehensible piece of content.
-
Do This:
-
Not This:
24. Is Dynamic Creative Testing Being Used?
Dynamic creative testing (DCT) ads take multiple creative components — images, videos, titles, descriptions and CTAs — and test them to find a winning mix of copy and creative.
The advantage of a DCT is that it lets the algorithm take the reins, making data-based decisions about creative more quickly than a human ever could. Plus, dropping 10 images, 10 headlines and 10 ad texts into a DCT means you’ve tested a thousand creative combinations in one fell swoop.
The disadvantage of Dynamic Creative Testing?
Lack of clarity. If one creative combination wins … what does that mean? What next step should you take?
If you use DCTs, make sure you’re only testing one variable at a time against a clear hypothesis about why each variant will or won’t work. It takes more brain power, but it also yields actionable results.
Bambu Earth doesn’t use DCTs, although they do have clearly demarcated campaigns dedicated to creative testing:

The copy remains consistent across all ads, but the creative changes:

This isolates the image as the only variable. If you have a clear hypothesis about why each image will or won’t work, you’ll be able to generate a wealth of insights, form better hypotheses, and improve creative moving forward.
25. How Many Different Ad Formats are Running?
We use the phrase “ad format” to refer to the different types or genres of ad creative: e.g. video, still image, carousel ads, user-generated content, etc.
For a comprehensive list of all the formats we’ve ever used — 30 types with 90 examples — jump over to our creative facebook ads toolkit.
Not only is it crucial to figure out what ad formats to run, you must determine where each ad format works best in your account.
Do stills work best in remarketing? Does video work better in prospecting? Does user-generated content beat professionally designed explainer videos?
Bambu Earth boasts a healthy mix of stills, UGC videos, and graphics with text. Much like a sensible stock portfolio, diversification is key — different formats work for different members of your audience.
26. Is Content Correctly Sized for Placement Specifications?
Content designed for Facebook and Instagram’s 1x1 default size performs better than content that’s shot in 16x9 and then resized to fit.
Of course, the opposite is equally true. Takeaway? Size matters.

To test your own sizes, go into ad preview mode and click through the placements. On desktop news feeds, this ad fits nicely; on Facebook Stories, which uses 9:16 as its native sizing, the image is smaller and the ad text gets cut off.

If you’re going to spend money on a placement, you might as well give your ad its best chance to succeed in that placement.
27. What Are the Baseline AIDA Metrics?
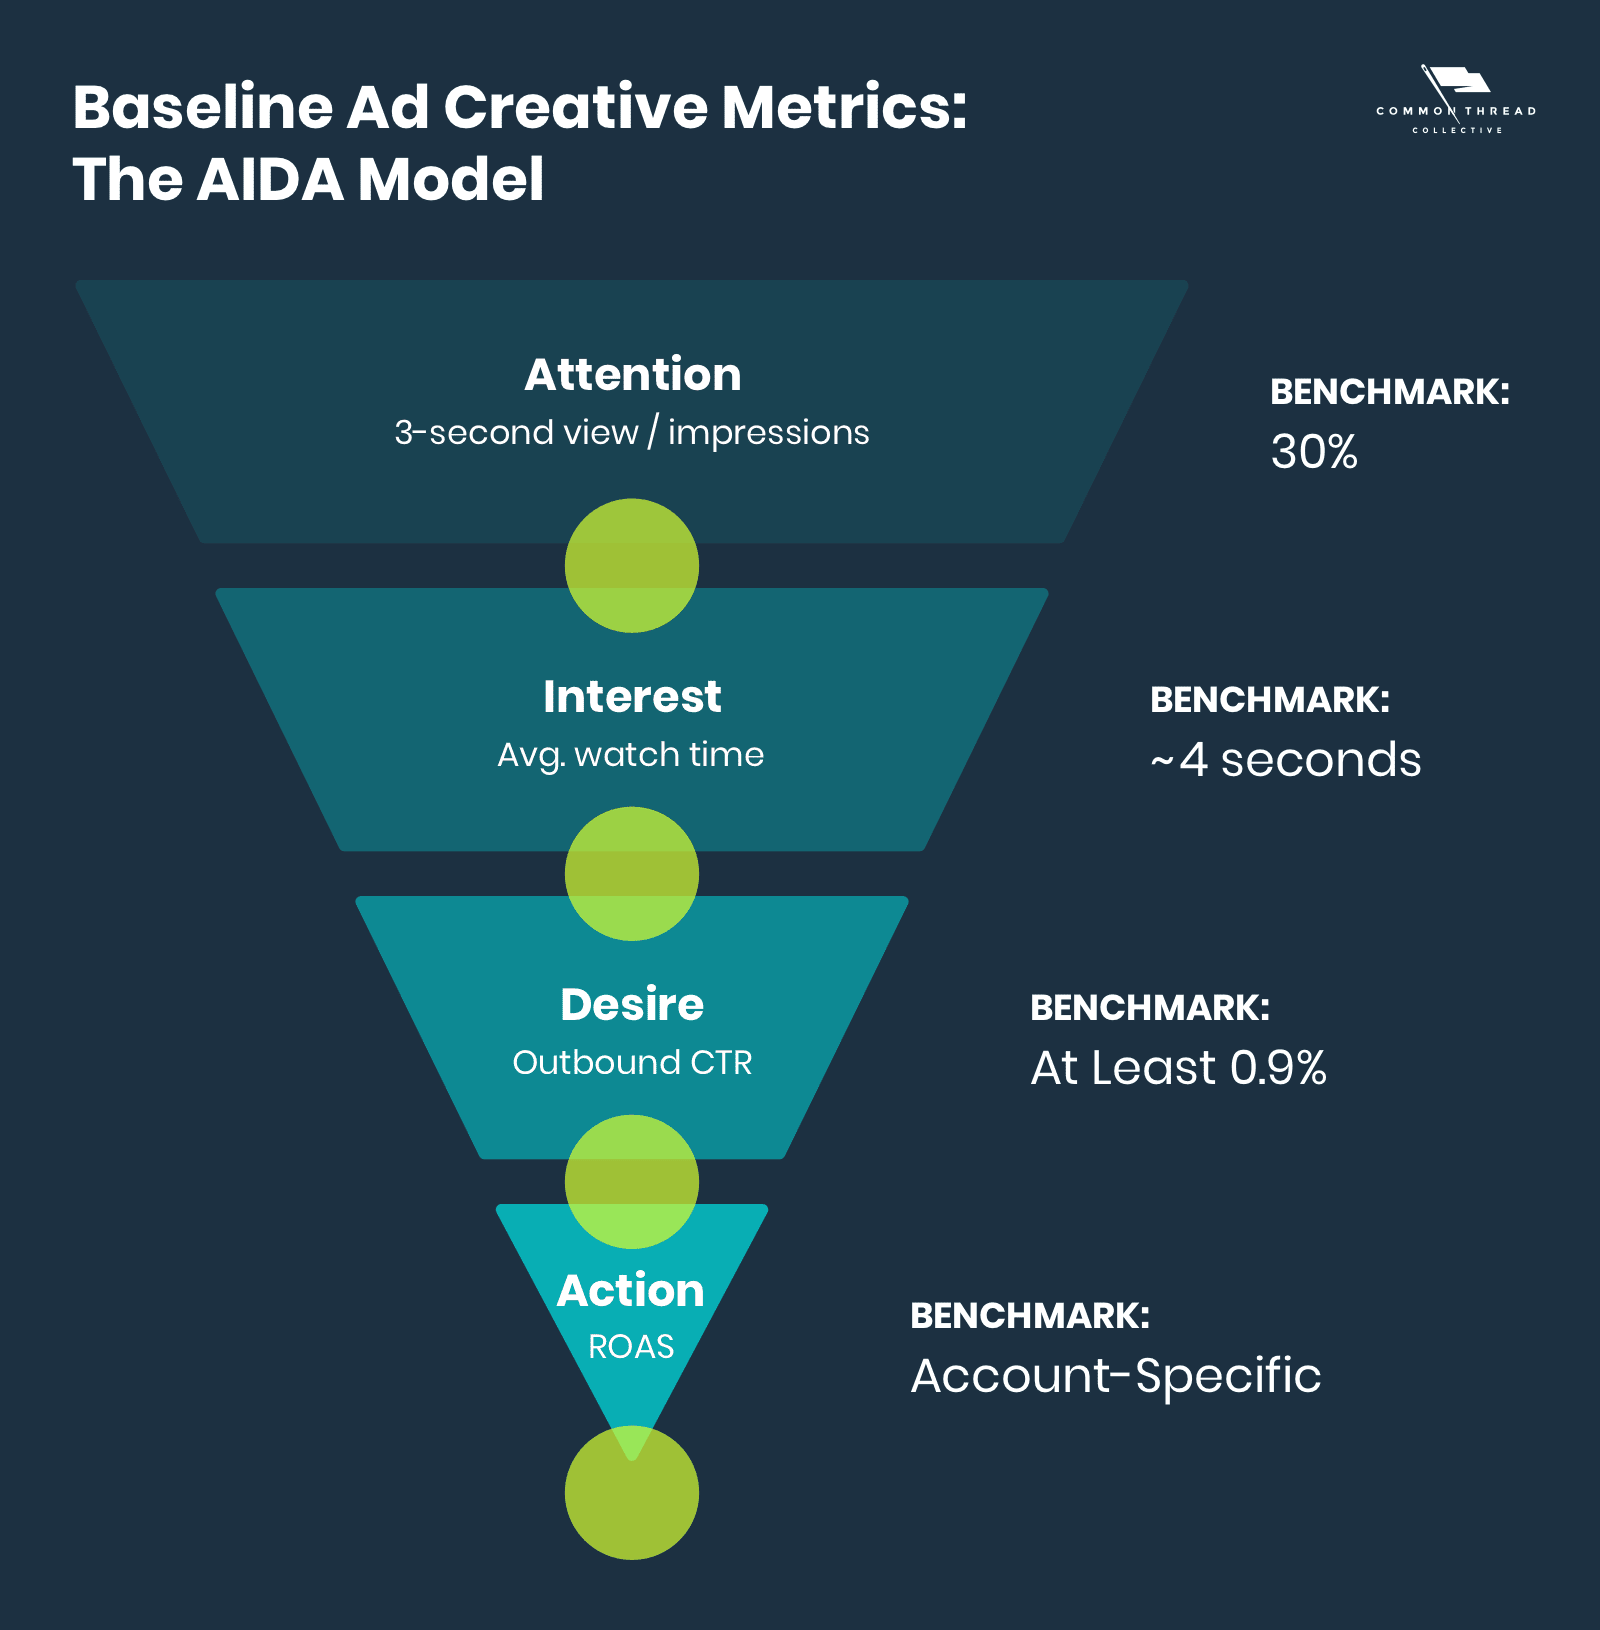
AIDA is one of the oldest behavioral models in the world. First formulated in 1898, by ad executive E. St. Elmo Lewis, it covers the series of effects an ad should have on a consumer:
- Attention: Interrupt the reader and get them to stop
- Interest: Transform attention into an emotional response
- Desire: Intensify that response into a tangible want
- Action: Move them into a measurable outcome
We translate these categories into metrics that provide insight into how people are experiencing our creative, and where in that experience they’re falling off:
- Attention: 3-second video views / impressions
Benchmark: 30%
- Interest: Average Watch Time
Benchmark: ~4 seconds
- Desire: Click-Through Rate (CTR)
Benchmark: At least 0.9%
- Action: Return on ad spend (ROAS)
Benchmark: Account-specific
Let’s look at Bambu Earth’s AIDA metrics over the last 30 days.
Its attention metric is about 14% overall. Although, some outlier campaigns are hitting much higher numbers:
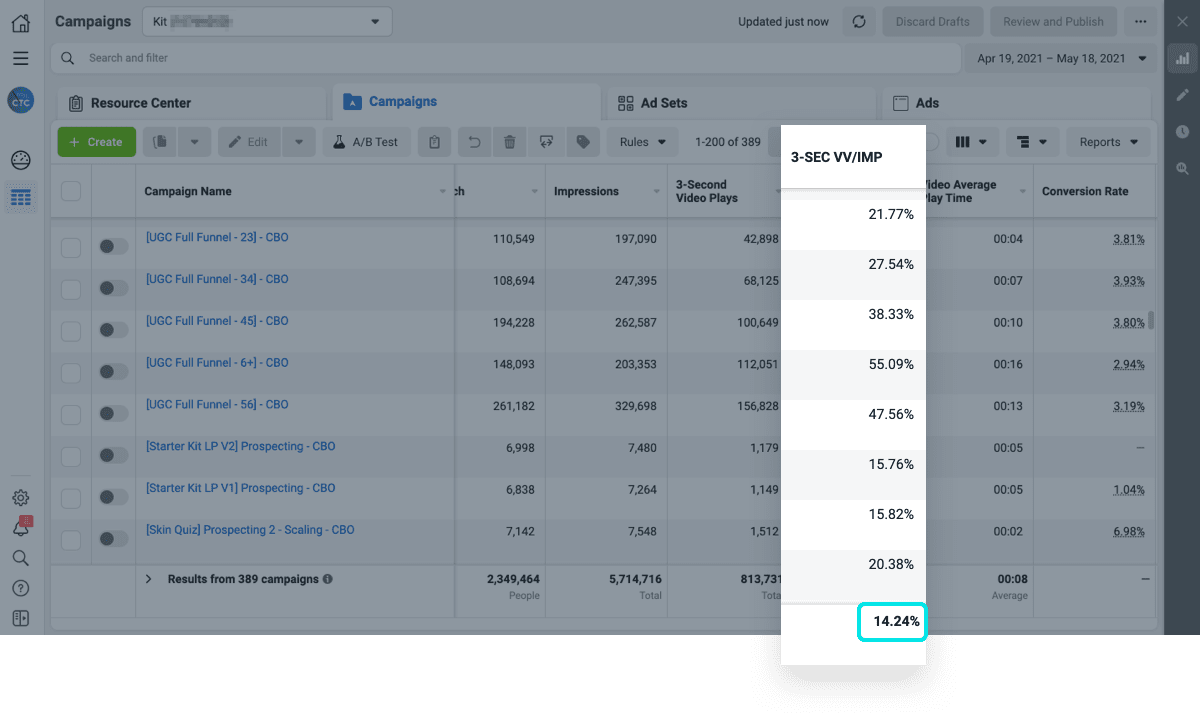
Specifically, this UGC campaign, which has a whopping 55% attention rate:

At the ad set level, that massive attention metric is actually coming from the broad-targeted prospecting ad set:

That same ad set has the highest average watch time (our “interest” metric) in the campaign. Both CTR and conversion rate are lower than they are in the other ad sets, even though they’re still much better than the account average:

That’s to be expected from a prospecting audience.
Still, there’s a bigger story lurking in the data. The AIDA metrics demonstrate that a broad female audience are fascinated by the user-generated content Bambu Earth is making in this ad.
We now have a clear iteration strategy — figure out how to increase CTR. We know people are hooked, we just need to give more of them a compelling reason to click.
AIDA metrics are leading indicators of ROAS. When they’re strong, a good ROAS isn’t far behind.
Next Steps: Serenity, Simplification, and Scale
The world of Facebook ads is complicated and ever-changing. An all-too-often recipe for burnout and burnt budgets.
In Facebook, as in life, the key to serenity is understanding what you can affect and what you can’t … and to simplify by putting effort towards the former.
How? It isn’t easy. But it’s also not a mystery. Center your strategy on three principles:
- High floor by letting Facebook’s algorithm and machine learning take care of the things humans can’t
- High ceiling by spending your time making resonant ad creative and testing your offers and messaging
- High profit by rooting your ad-account success in your big-picture business goals, not a single channel
If you’ve gone through this guide and you’re wondering, “What do I do next?” we get it. And we’re here to help. Be sure to grab the 27-point audit and full video guide for yourself.
Or, if you currently spend more than $15k per month on advertising, jump over to our Facebook ad agency page. Book a time and we’ll run this audit for you to uncover the biggest opportunities in your business right now.
We won't send spam. Unsubscribe at any time.

Jimmy Olmos is the Paid Social Manager at Common Thread Collective. An entrepreneur at heart with a passion for growing businesses. He lives in Northern Virginia, just outside of Washington, D.C. and loves spending time outdoors with his wife and two kids when he's not scaling ad accounts!

Lexi Coco is an Expert Buyer Manager at Common Thread Collective. She loves the data driven strategy that backs media buying, creative problem solving in ad accounts, and coaching buyers into successful client partners. You can connect with Lexi on Linkedin here.


