The DTC Index
Your #1 source for on-the-ground ecommerce data.
Methodology: Ecommerce Data Calculations
This section goes out to all our fellow data nerds … plus, anyone who wants to better understand the charts and graphs contained within the reports.
Ecommerce Data Calculations are based primarily on Statlas: our proprietary ecommerce growth tool composed of data from Common Thread Collective (CTC) clients, ADmission members, and Statlas users.
To pull together the full story, we rely on ~300 ecommerce businesses, the experience of our analysts, and a pinch of CTC data magic.
Inclusion
To be included in Ecommerce Data, stores must meet three requirements …
-
Report revenue OR Facebook Spend OR Google Ads Spend for all but 4 days between January 1, 2020 and the end of the most-recent week
And
-
Be consistently reporting and connected to Statlas for at least the last month; stores must be eligible for our dataset for 1 month prior to being added to that dataset
And
-
Be included in the list of currencies we can convert:
- USD - United Stated Dollar (Dolla Dolla Bills, y’all)
- JPY - Japanese Yen
- BGN - Bulgarian Lev
- Cypriot - Cypriot Pound (now the Euro)
- CZK - Czech Koruna
- DKK - Danish Krone
- EEK - Estonian kroon
- GBP - Pound Sterling
- HUF - Hungarian forint
- LTL - Lithuanian litas
- LVL - Latvian lats
- MTL - Maltese lira
- PLN - Polish złoty
- ROL - Romanian leu
- RON - Romanian leu
- SEK - Swedish krona
- SIT - Slovenian tolar
- SKK - Slovak koruna
- CHF - Swiss franc
- ISK - Icelandic króna
- NOK - Norwegian krone
- HRK - Croatian kuna
- RUB - Russian ruble
- TRL - Turkish lira
- TRY - Turkish lira
- AUD - Australian dollar
- BRL - Brazilian real
- CAD - Canadian dollar
- CNY - Renminbi
- HKD - Hong Kong dollar
- IDR - Indonesian rupiah
- ILS - Israeli new shekel
- INR - Indian rupee
- KRW - South Korean won
- MXN- Mexican peso
- MYR - Malaysian ringgit
- NZD - New Zealand dollar
- PHP - Philippine peso
- SGD - Singapore dollar
- THB - Thai baht
- ZAR - South African rand
Formulas
Here’s a rundown of the formulas we use to calculate the Ecommerce Data …
Average Weekly Ecommerce Revenue
Total Ecommerce Revenue ÷ Total Stores reporting

Average Weekly Channel Spend
Total Channel Spend ÷ Total Stores reporting

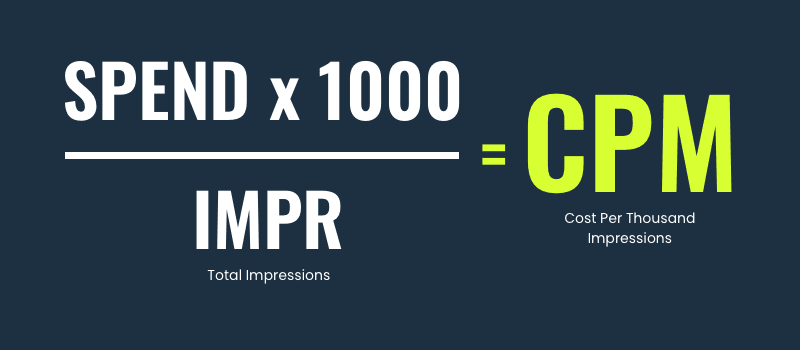
Average Weekly Channel CPMs (Cost per 1000 Impressions)
(Total Channel Spend x 1000) ÷ Total Channel Impressions
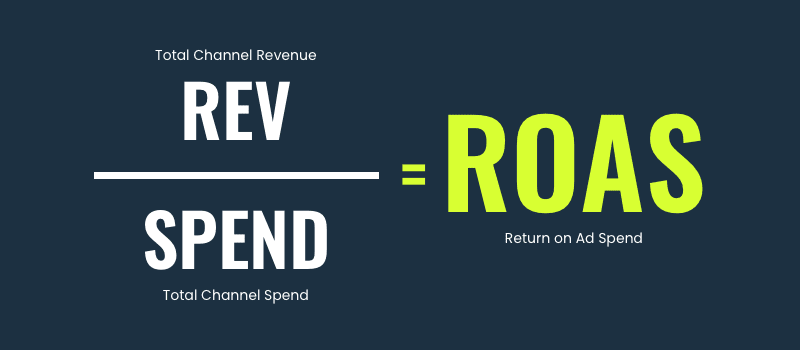
Average Weekly Channel ROAS (Return on Ad Spend)
Total Channel Revenue ÷ Total Channel Spend
Average CPC (Cost per Click)
Total Spend ÷ Total Clicks

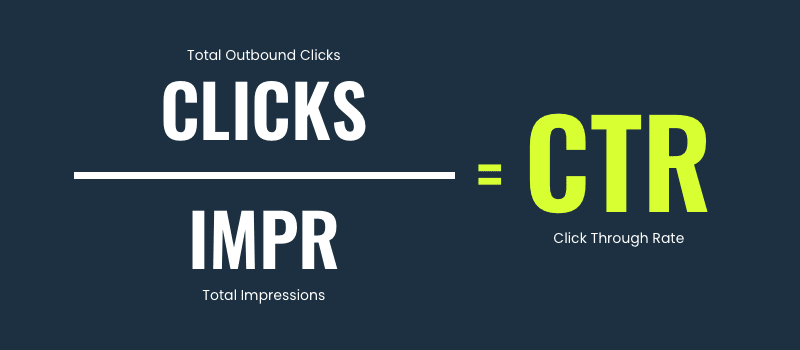
Average CTR (Click through Rate)
Total Channel Clicks ÷ Total Channel Impressions
Average CR (Conversion Rate)
Total Channel Buys ÷ Total Channel Clicks

MER (Marketing Efficiency Ratio)
We employ three parameters before calculating:
- Filter out all stores with average MER above 14
- Filter out all days with MER above 16
- Calculate MER for each store and take the average MER of that MER
(Σ All Stores(Total Store Revenue with Spend ÷ Total Store Ad Spend)) ÷ Number of Stores

Average AOV (Average Order Value)
Total Revenue ÷ Total Orders

Average Weighted CAC (Cost of Acquired Customer at the store level)
Total Ad Spend ÷ Total Customers

Average CPA (Cost Per Acquisition calculated directly from Facebook and Google reporting)
Total Ad Spend ÷ Total New Customers

aMER (Acquired Marketing Efficiency Ratio)
Total New Customer Revenue ÷ Total Ad Spend

Understanding How These Metrics Impact Your Business
We’ve covered a lot of data points, formulas, and metrics in this methodology. But, ultimately, our goal is to help you understand how these metrics play into the success of an overall campaign.
The best way to do that?
Plug them into the equation for channel ROAS.
From a high level, the ROAS formula looks like this:
ROAS = Revenue ÷ Spend
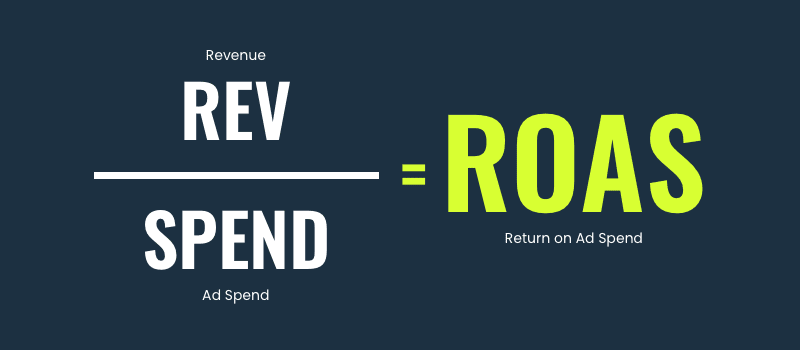
By decomposing the equation, you can see how different parts of the funnel are performing by breaking down “revenue” and “spend” into some of the metrics we previously mentioned.
ROAS = (1 ÷ CPC) x CR x AOV

The equation can be decomposed even further, pulling in CPM and CTR:
ROAS = (1000 ÷ CPM) x CTR x CR x AOV

So, why should you care about all of these metrics?
Because every single one of them contributes to the success of an ad campaign. And, understanding what each metric means — and its importance within the overall health of your business — enables you to pinpoint the exact areas of improvement on a granular (and more tangible) level.
The fine print …
If necessary, we make two adjustments so as not to exclude data that is over-attributed. Meaning, the platform has attributed more revenue than the store actually received on a given day —i.e., if Facebook attributed $1,000 to a store, but the store only reported $950, then we adjust the revenue down to $950.
Adjustment 1
Channel revenue on a day must be equal to or less than all of the reported revenue from the actual store; each individual channel’s revenue is adjusted down where necessary proportional to the revenue claimed by that individual channel divided by the revenue claimed by all channels:
channel revenue = (Revenue claimed by individual Channel ÷ Revenue claimed by all Channels) * Total Store Revenue
Adjustment 2
Channel purchases claimed by all channels for a store cannot exceed the total number of purchases from that store on any given day. If purchases claimed by all channels exceed the number of total store purchases, the individual channel purchases are adjusted down proportionately to the claimed purchases:
channel purchases = (Purchases claimed by individual Channel ÷ Purchases claimed by all Channels) * Total Store Purchases