Exclusive Access to the DTC Metrics that Matter Most
27 Key Metrics, Updated Weekly
From store CAC to Facebook ROAS, the DTC Index contains charts tracking year-over-year data points from all parts of the funnel.
Subscribe Now

by Steven Rekuc
May. 31 2023
Brands ask us the same question over and over again:
Should we expand into Pinterest?
Or Snapchat?
Or how about TikTok?
Not to mention Bing, Twitter and more.
The answer to that question is, more or less: “Try it and see if it’s worth it.”
The easy answer: a good ROAS.
Unfortunately, attribution is messy and inaccurate. Some platforms look better or worse than they report.
So how can you really know if an ad channel is doing anything for your ecommerce revenue?
Meet Statistical Hypothesis Testing.
To understand how this approach works, we’ll break down how we use Statistical Hypothesis Testing at CTC:
Interested in Ecommerce Data? We have in-depth data on 27 metrics across 6 verticals.
Though it’s an advanced mathematical concept, the best way to think about it is as a simple question:
Is one set of data points like another?
Of course, the answer is a little more complicated than a simple side-by-side comparison.
For example, the histogram below shows the distribution of a brand’s daily sales from Shopify before and after that brand started selling their products on Amazon, excluding holidays and sale days:
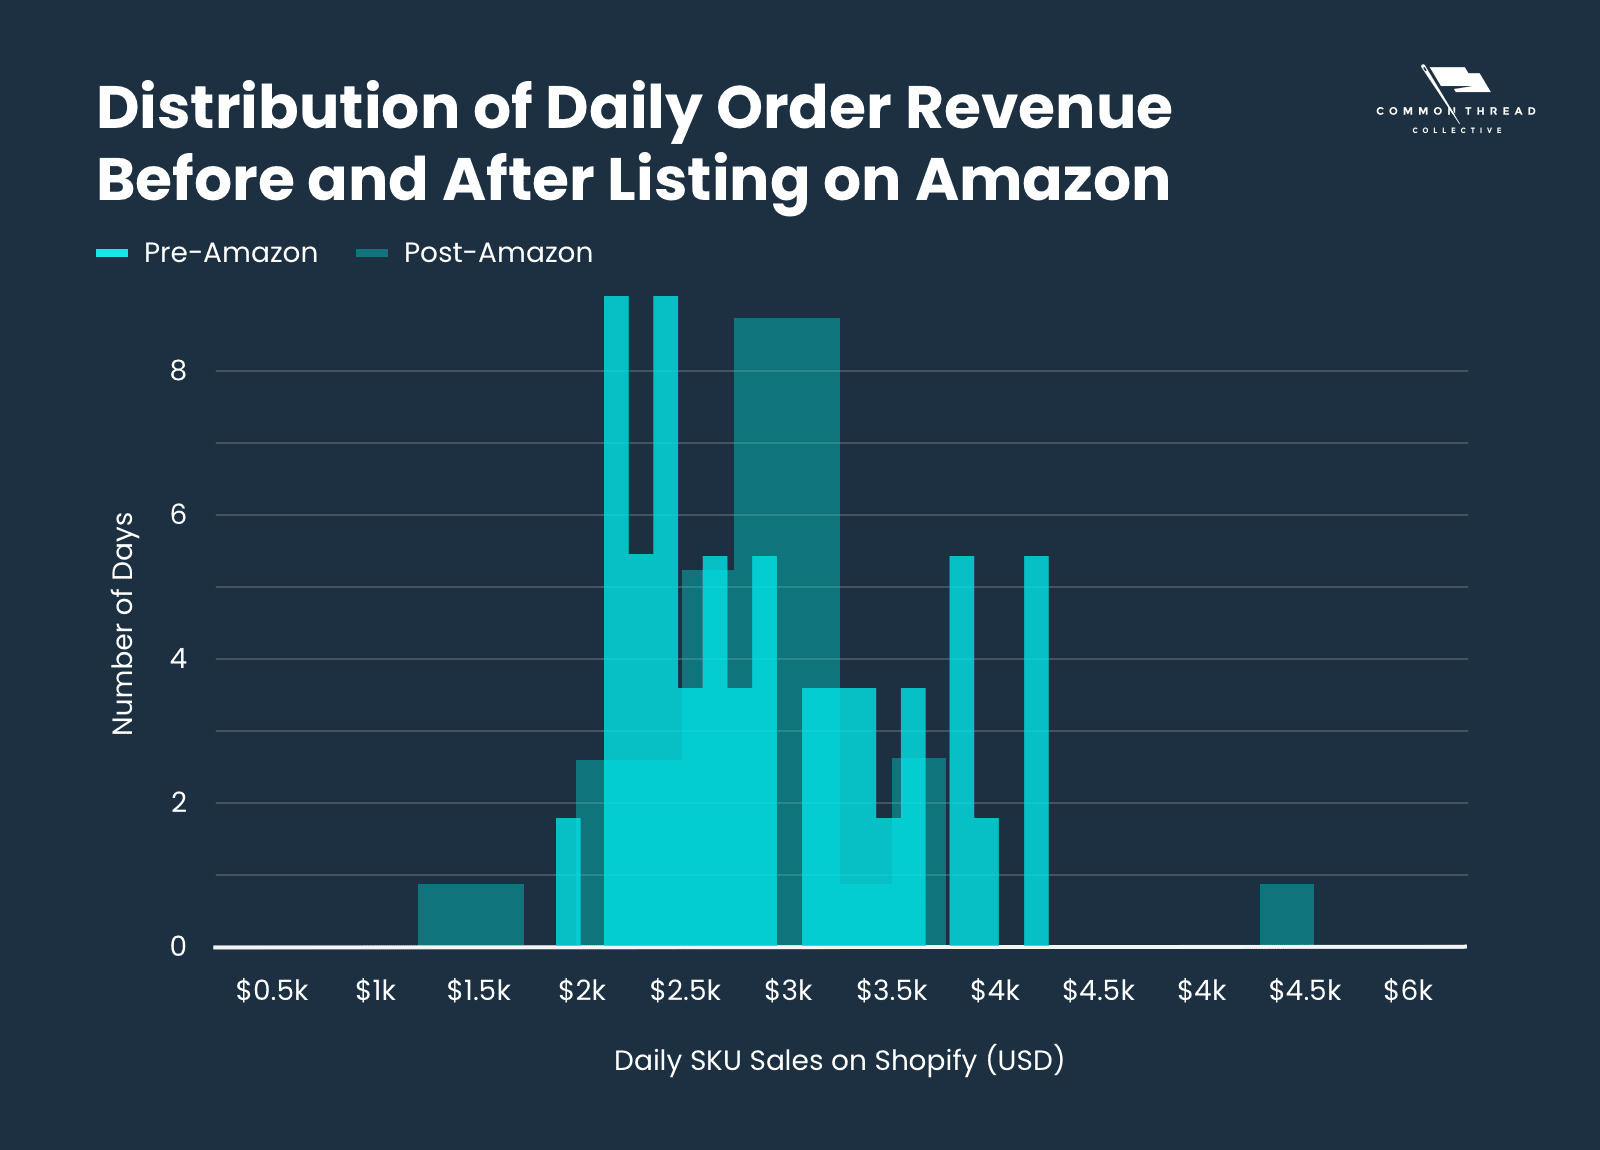
What does this chart mean?
Are the Pre-Amazon bars “less” than the Post-Amazon bars in this chart?
Yes? No? Maybe so?
Clearly, there’s too much room for interpretation here.
Fortunately, there’s a better way.
First, let’s compare the mean of each distribution from the above chart.
Before Amazon Average: $2625
After Amazon Average: $2827
That settles it, right?
Not really.
Before we can accurately compare the two sets of data points, we must answer one important question:
Is the true mean of distribution behind the Pre-Amazon points less than the true mean of the distribution behind the Post-Amazon points?
Translated from math-ese, this means, roughly:
We used a random sampling of points (and excluded holidays and sales days) to calculate these averages.
So, there’s a possibility that a different sampling of points from both datasets would, in fact, yield the opposite result.
What we need to uncover is the probability that the average of our random sampling is not characteristic of the true average of the whole dataset.
The key to knowing if your comparison of 2 datasets is trustworthy is a little number called the P-Value.
Wait … what’s a “P-Value?”
Put simply, the P-Value measures the probability of obtaining the same result over a different sampling of data points.
Getting to your P-Value is a little complicated, however.
First, you have to calculate the “t-Value” (don’t ask us why):
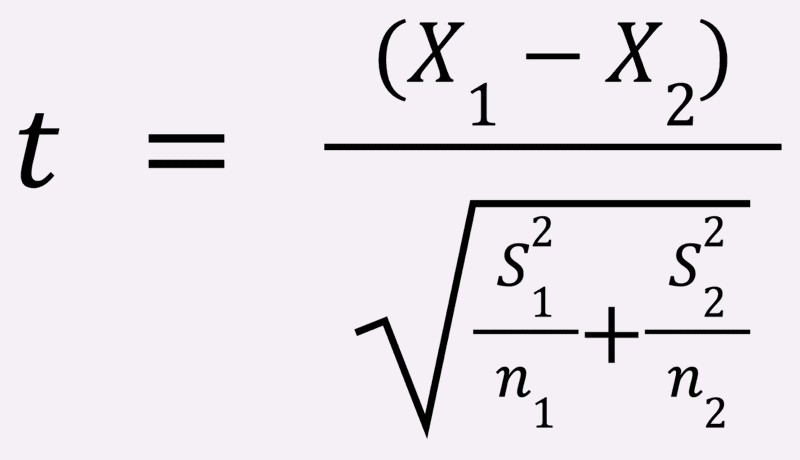
Once you have your t-Value, you’ll need to look up the corresponding P‑Value in a table.
This comparison takes into account the number of data points that are in the sample, as well as the spread of those points (mean and standard deviation).
You can calculate all this online here or using the T.Test function in Excel or Google Sheets.
Above, we determined a the p-value of 0.26:
There is a 26% chance that the Pre-Amazon distribution actually has a higher true average than the Post-Amazon distribution.
Conversely, there’s a 74% chance that the Post-Amazon true average is greater than the Pre-Amazon true average.
In other words, our initial assumption is more likely correct than not.
Though that seems like a win in favor of Amazon, we would likely state this as “inconclusive.”
Why?
The generally accepted threshold for “certainty” — the passing grade, if you will — is 90%.
We typically set this threshold prior to running the test so that we’re not influenced by the test to lower the threshold (or raise it) to come to a particular conclusion.
Let’s go back to our original question:
How do we determine if an ad channel is worth it?
If we’re spending money on an ad channel, store sales should measurably increase.
So how do we determine if spend in that channel had an impact on sales?
First, we turn that ad channel on for a period of time. Then, switch it off for a similar period.
Then, we measure the sales from before and after turning the platform off.
The sales from when the channel was “on” must have meaningfully higher sales than when the channel was “off,” or the channel isn’t worth the spend.
Knowing what we need to determine is the easy part, however.
How to determine the platform’s impact is Statistical Hypothesis Testing’s job.
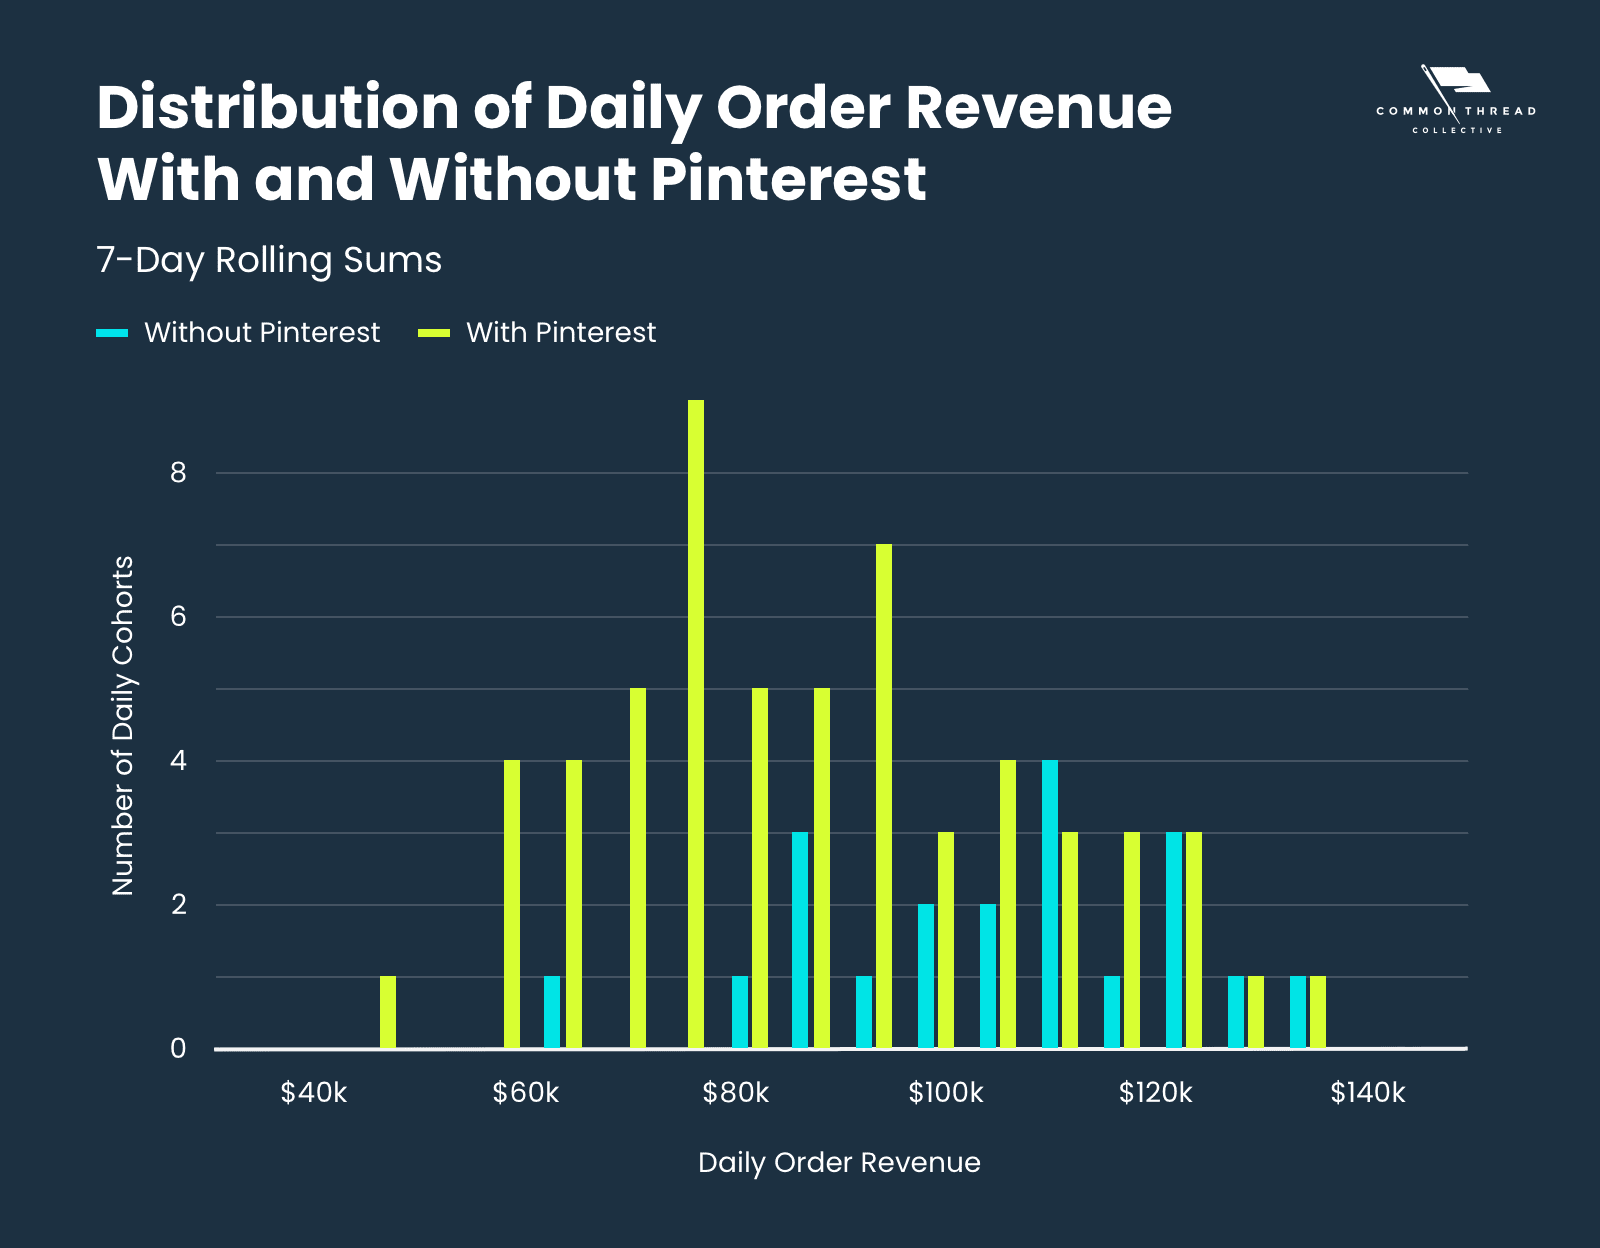
Here’s an example.
We have an apparel brand that spent money on Pinterest, but they don’t know if it produced meaningful results.
The brand had already turned the channel off and on by themselves. This gives us 2 distinct data sets:
Set 1: Daily Store Sales when Pinterest was off (no spending)
Set 2: Daily Store Sales when Pinterest was on (some spending)
We set up for the statistical test by defining what we call, in statistics-ese, the Null and Alternative Hypotheses.
In any test, the Null Hypothesis postulates that no impact occurred.
In this case, the Null Hypothesis is:
Daily Average Store Sales with Pinterest spend are the same or less as they are without.
The Alternative Hypothesis postulates that whatever you’re testing did make an impact.
For our test, the Alternative Hypothesis is:
Daily Average Store Sales were greater when Pinterest received ad spend.
Results:
Daily Average Stores Sales with Pinterest was $89,458; Daily Average Stores Sales without Pinterest was $107,558.
P-value: 0.9995.
A P-Value of 0.9995 means we can be 99.95% certain that Pinterest had either no impact or even a negative impact on sales.
A Health & Wellness brand wanted to test out their bigger ad channels; they turned off spend during early December to see how that impacted their sales.
Here is a chart that shows a 7-day rolling average of their Google Spend vs 7-day rolling average of their conversions (they only sell 1 product).
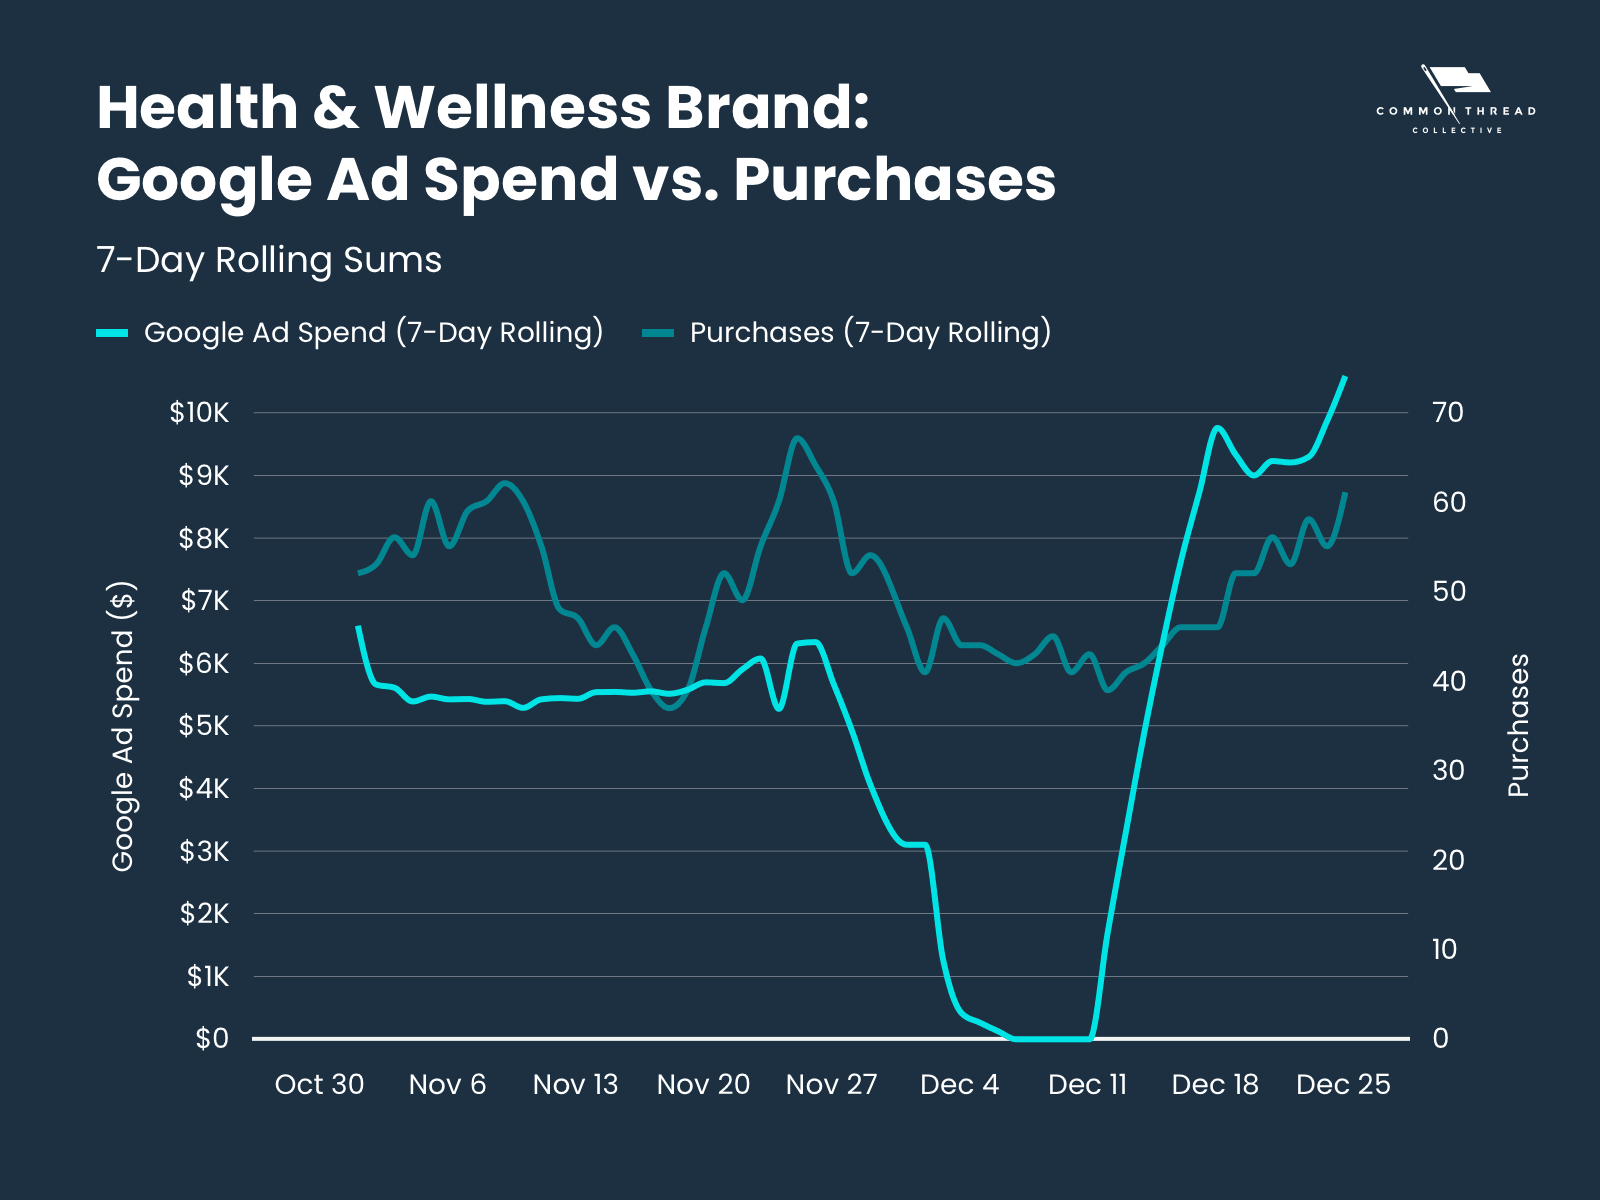
Set 1: Stores Purchases when Google was off (no Google Ads Spend)
Set 2: Stores Purchases when Google was on (some Google Ads Spend)
Null Hypothesis: The 7-day Average Store Sales when Google Ads received spending is the same as when Google Ads received no spending.
Alternative Hypothesis: The 7-Day Average Stores Sales were greater when Google Ads received some spending.
Results: 7-day Average Store Purchases with Google Spend was 68.7; 7-day Average Store Purchases without Google Spend was 50.2.
P-value: 0.00002 This means there is a 99.998% probability that sales increased when Google Ads was turned on.
This makes it clear that Google Ads did have an impact on purchases.
Hypothesis testing is an excellent way to compare 2 different sets of data and see if they are different.
This really applies when you want to test out one factor (an ad channel in the case of this article) and can keep other factors essentially the same.
We’ve also used this approach to test out if Amazon is cannibalizing website sales — get the results of this test on LinkedIn or Twitter.
Obviously, things can get a little complicated. We suggest reaching out to us to talk about testing your ad (or sales) channels.

27 Key Metrics, Updated Weekly
From store CAC to Facebook ROAS, the DTC Index contains charts tracking year-over-year data points from all parts of the funnel.
Subscribe Now
Steve Rekuc is the Ecommerce Data Analyst at Common Thread Collective. Based in Vail, Colorado, he has been analyzing data from a systems perspective since his time as a graduate student at Georgia Tech two decades ago. Steve can be found on Twitter and LinkedIn examining data and providing interesting insights into ecommerce, marketing, and data analysis.