Implement the Prophit System for Your Brand
We’ll work with you to custom-build CTC’s predictable, profitable growth system for your ecommerce business.
Get Started

by Taylor Holiday
Jan. 26 2024
Imagine you’re running an ecommerce business that has raised funding that began in 2021 or 2022, under the promise of driving large, incremental top-line revenue growth.
Suddenly, you find yourself in 2024.
Your top-line has continued to grow, but at a net-negative cost every month. As a result, available capital begins to dwindle. Nobody will fund negative profitable growth in today’s environment.
Suddenly, there's an obligation for your business to be self-sustaining and profitable.
The turnaround is not just possible; it's within reach through a strategic overhaul of your Profit and Loss (P&L) analysis and a laser-focused approach to first-order profitability.
How one brand moved from a six-figure burn rate to profitability in just three months …
Using their story as our guide, we'll unravel the strategic steps and insights that can catapult any struggling ecommerce business into financial health.
This blog post is another in our “Bridges” series — bridging the gap between marketing and finance.
In our previous installments in this series, we’ve laid out foundational strategies. But, today we will dive deeper into a specific P&L that illustrates a real scenario faced by many ecommerce businesses.
We've changed all the numbers and identifying attributes, reorganizing the P&L such that this is illustrative of a real scenario
Our journey begins with a deep dive into the P&L statement of this brand, stripped of its identifying attributes to preserve anonymity while providing a real-life scenario.
This analysis is pivotal for marketers to inform media strategy and financial positioning.
Let’s take a look.
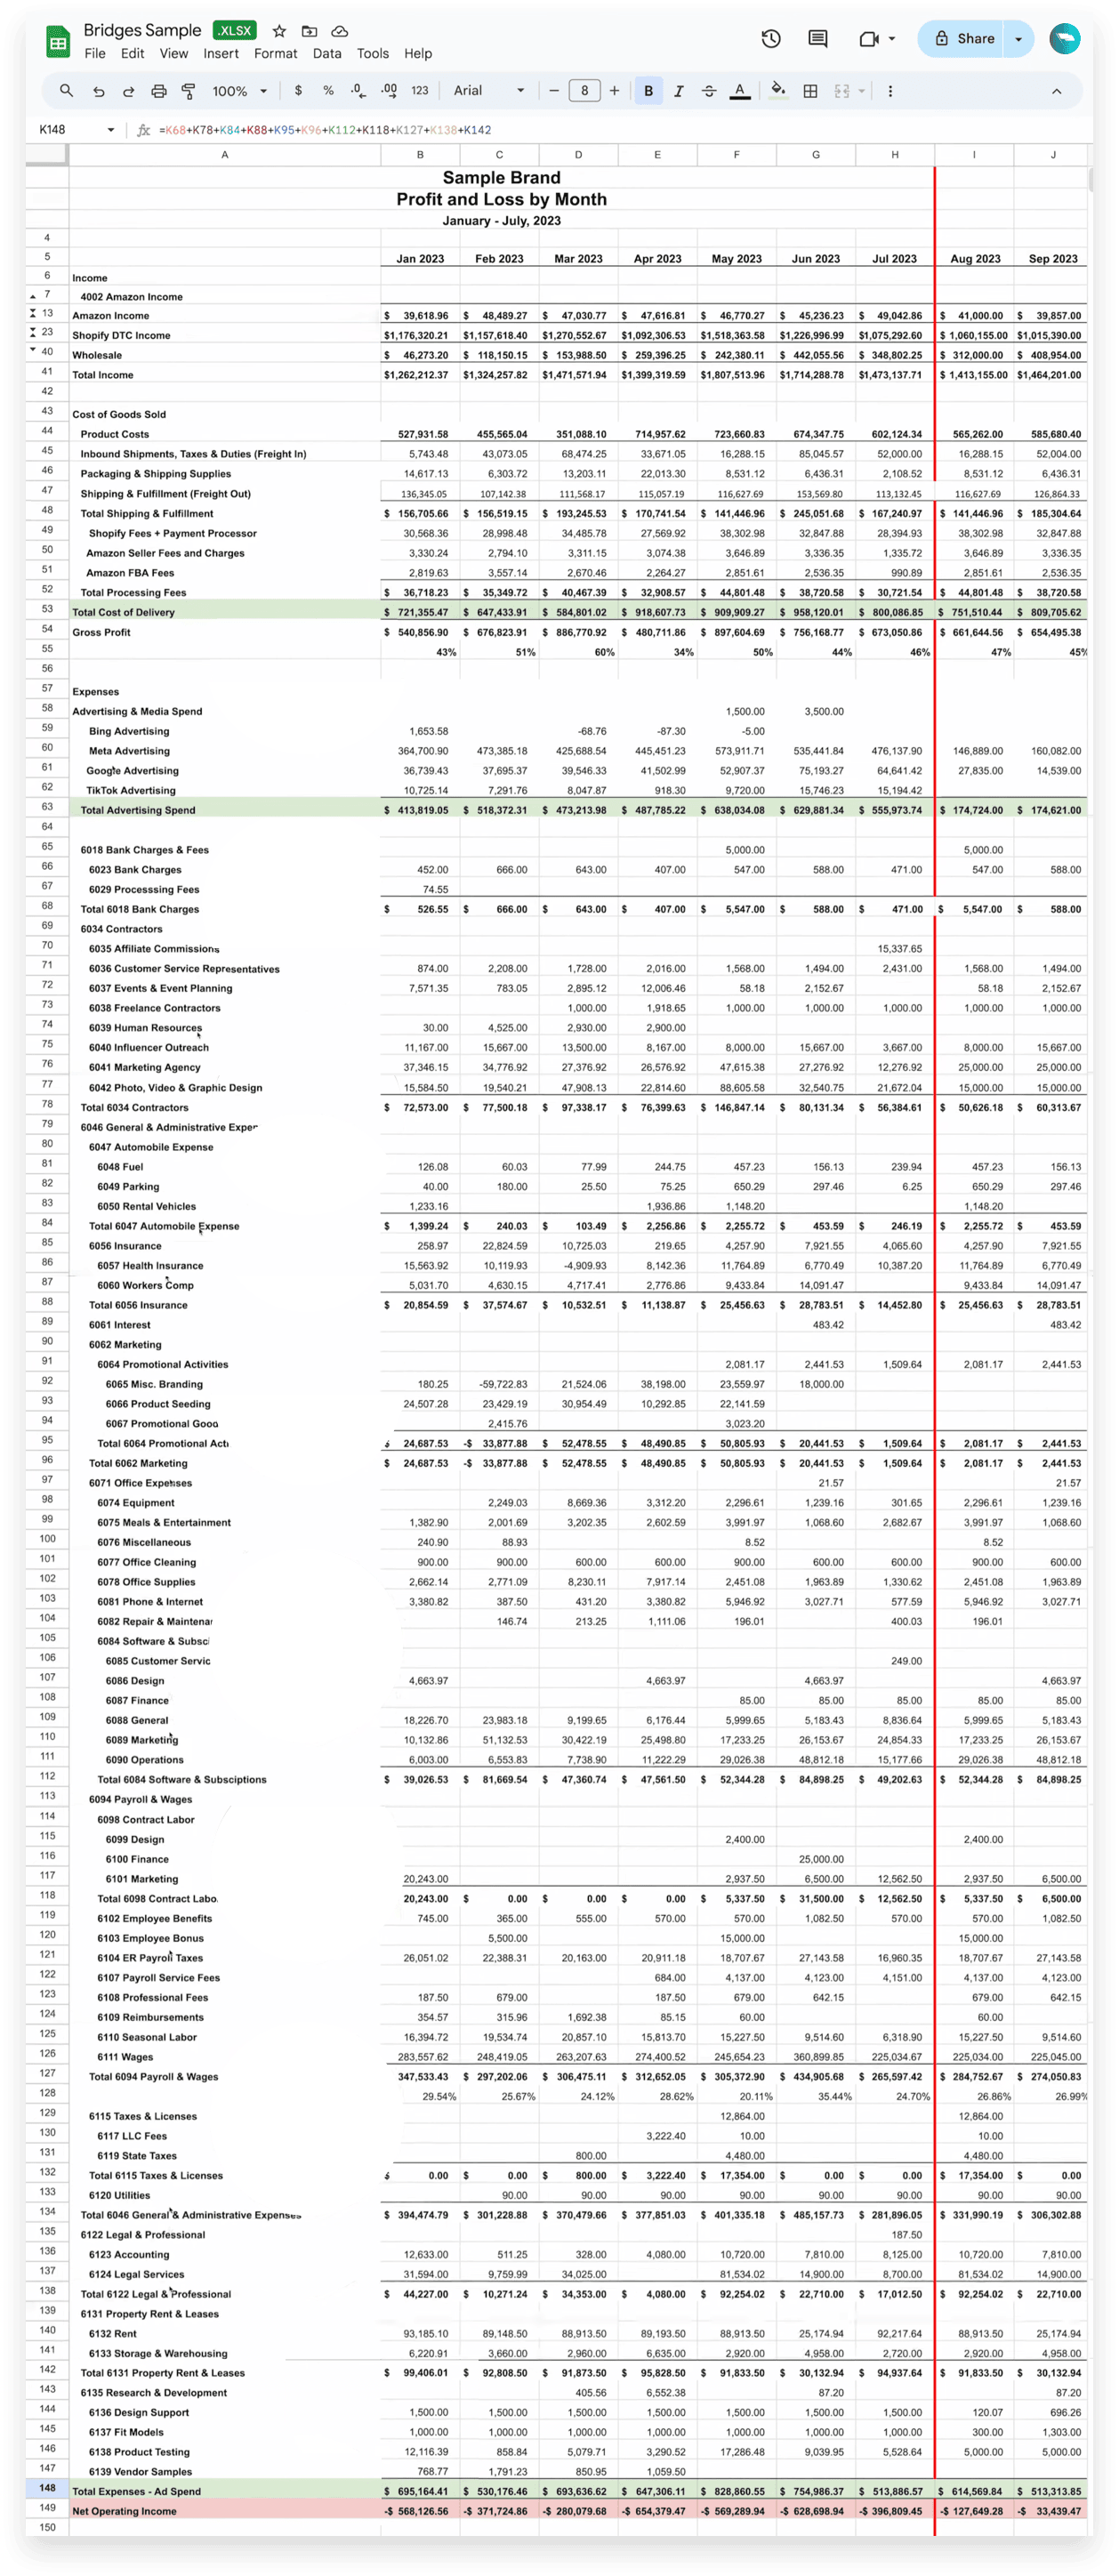
By examining revenue streams from Amazon, Shopify, and wholesale, alongside the comprehensive breakdown of the cost of delivery, we uncover the initial financial state of the brand.
This sample Profit and Loss Statement has been largely simplified. If you’d like to learn more about how to create the ideal P&L, we cover that in the first installment of our Bridges Series.
We need to make sure that we can understand where the revenue is being destroyed, and then figure out what we can do about it.
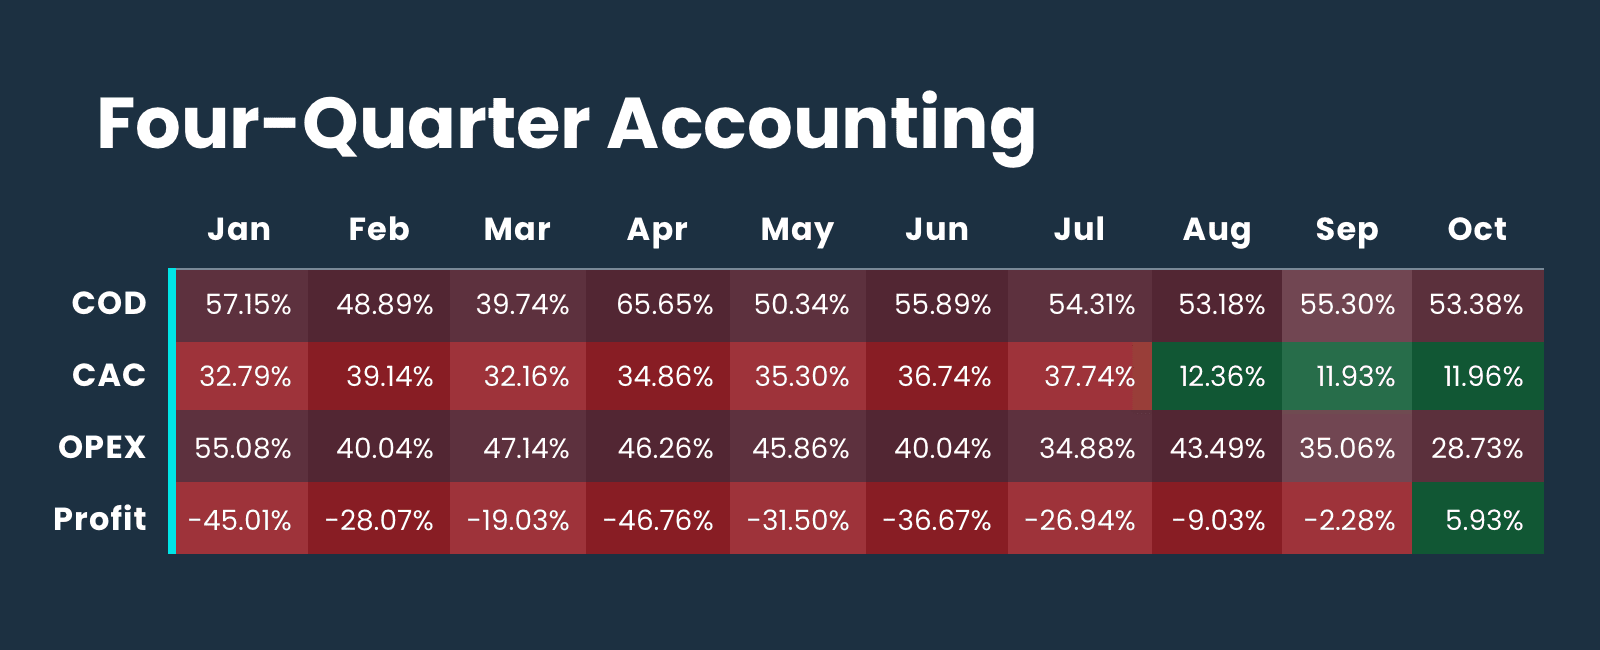
To begin our assessment, we’re going to build a Four-Quarter Accounting table. To revisit Four-Quarter Accounting, this essentially means structuring your P&L such that it establishes four key categories to focus on for systemic growth out of the countless categories currently broken down in our P&L.
Those four categories include:
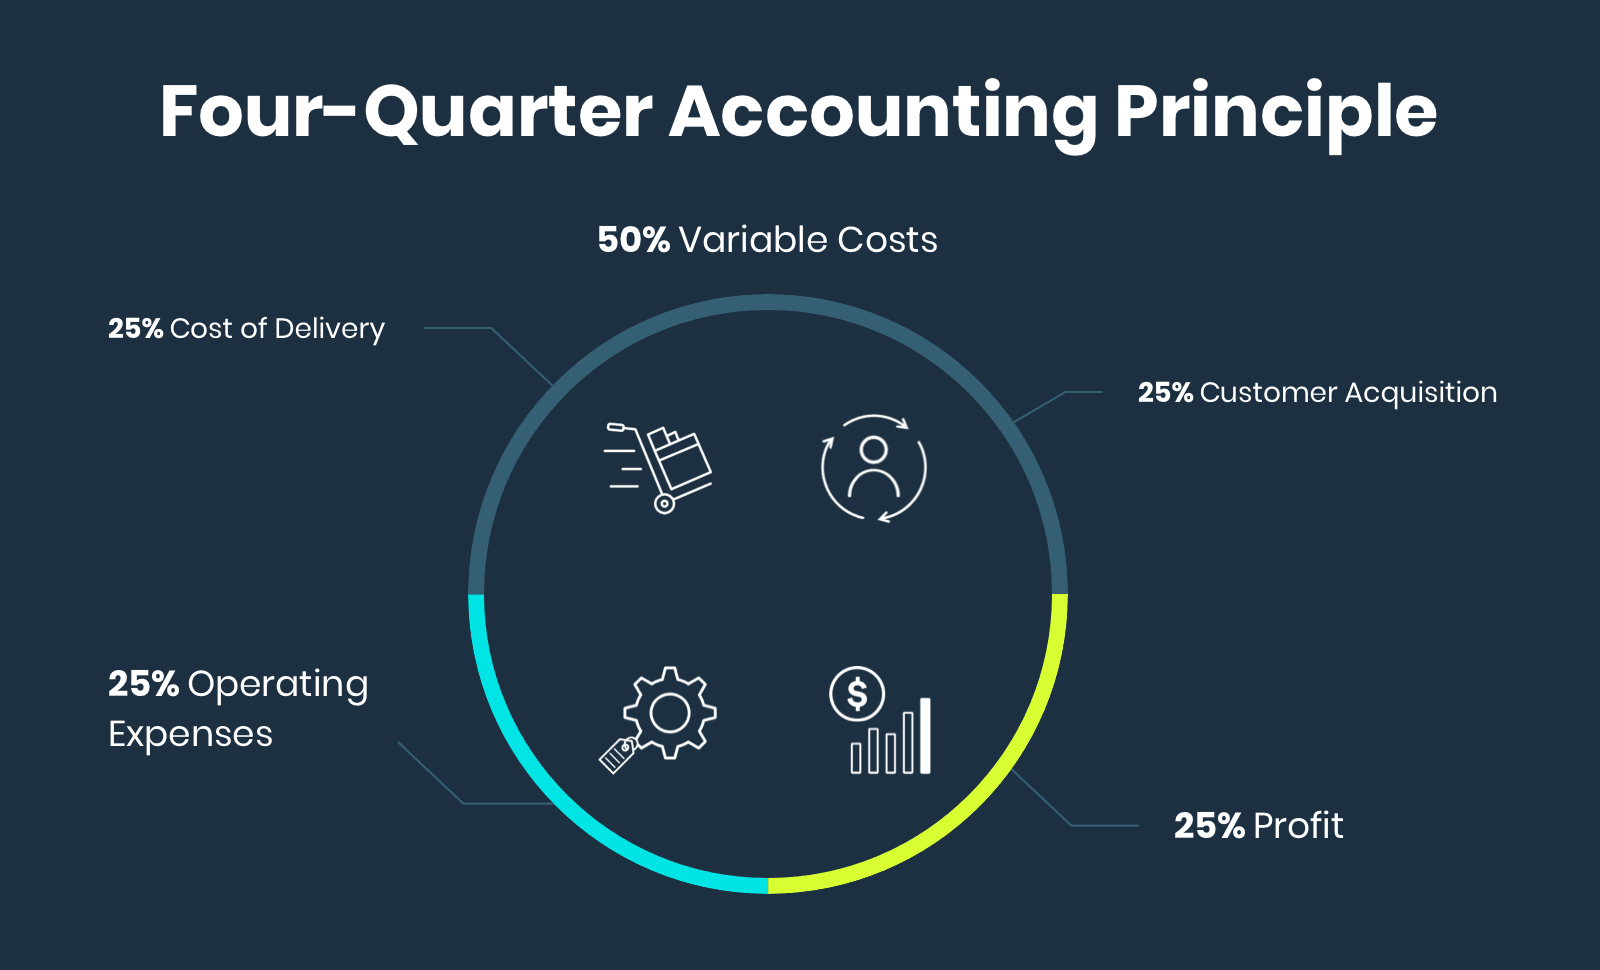
This will give us a very quick glimpse into key areas of improvement for this brand.
When applied to the P&L for our apparel business, the Four-Quarter Accounting table looks something like this:
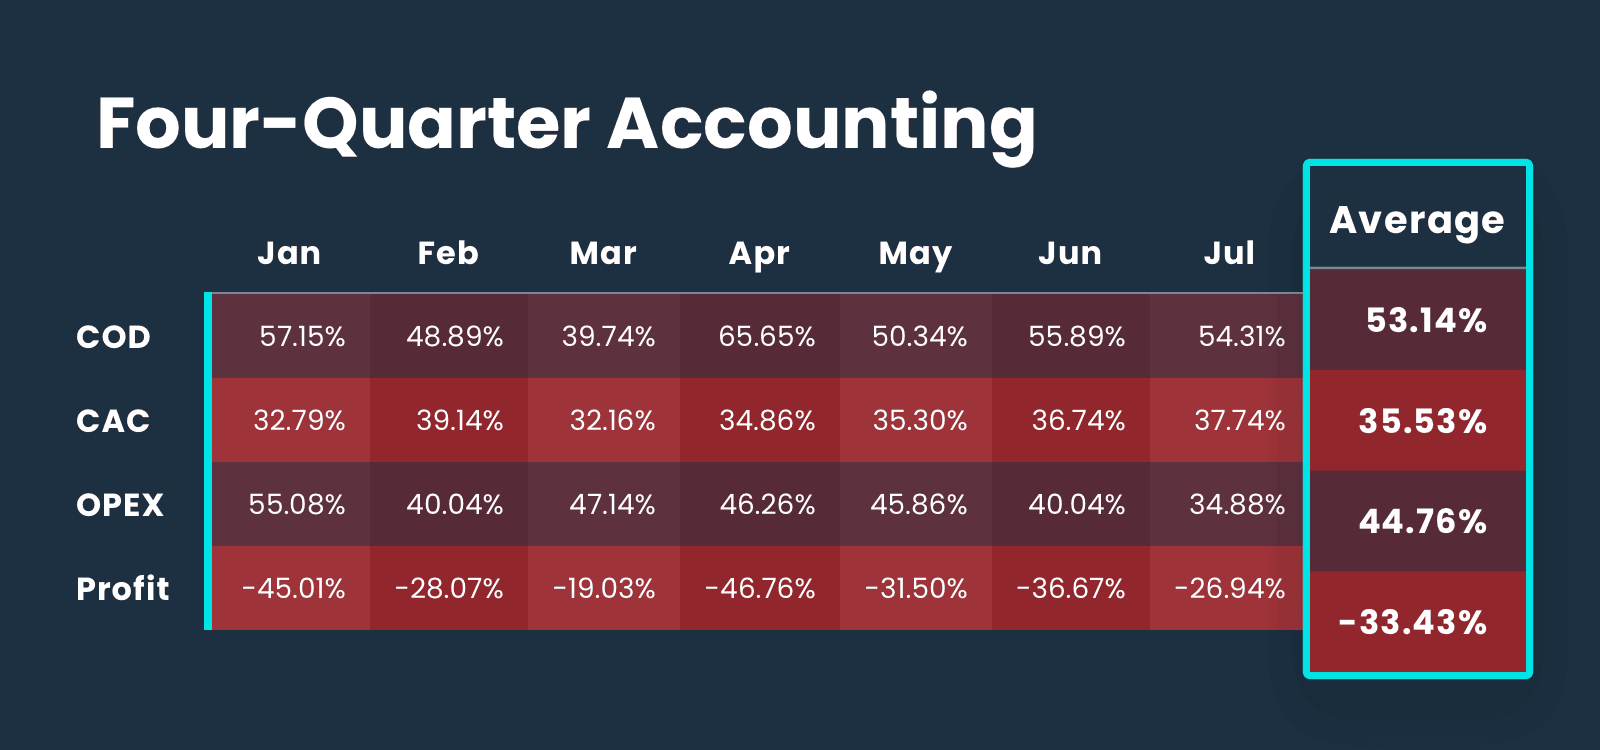
Based on our Four-Quarter Accounting benchmark using 25/25/25/25, there are several areas with room for significant improvement. However, industry plays a key role in determining benchmarks for some of our metrics. Every industry's composition of these metrics is slightly different.
'Cost of Delivery' is our term for encompassing all variable expenses involved in getting a product from the manufacturer to the customer.
This includes:
As mentioned above, our general target for cost of delivery is around 25%.
This business is in the apparel category. In apparel, it's wildly difficult to get to a gross profit number or, or a total cost of delivery in the 25% range. It's just not going to happen.
Issues related to the quantities of variable SKUs, MOQ restrictions, discounting that's common in the space, the complexity of production, and return rates will often cause problems with hitting a 25% total cost of delivery.
This business is currently sitting around 53%, and in the apparel category, you're not going to get too much better. 60% in apparel is great, 70% is amazing, and 50% is closer to standard.
Despite being slightly higher than we would like, this isn't going to be the first area that we attack. Unless this percentage is comprised mainly of shipping and fulfillment costs, we want to pull other levers that will impact this business more quickly.
As a marketing growth partner provider, it's very hard to affect the product cost. That takes negotiation with the manufacturer, and finding new suppliers. It's a very complex process.
The two things that we care a lot about are …
Now, we’re diving slightly deeper into the cost of delivery component.
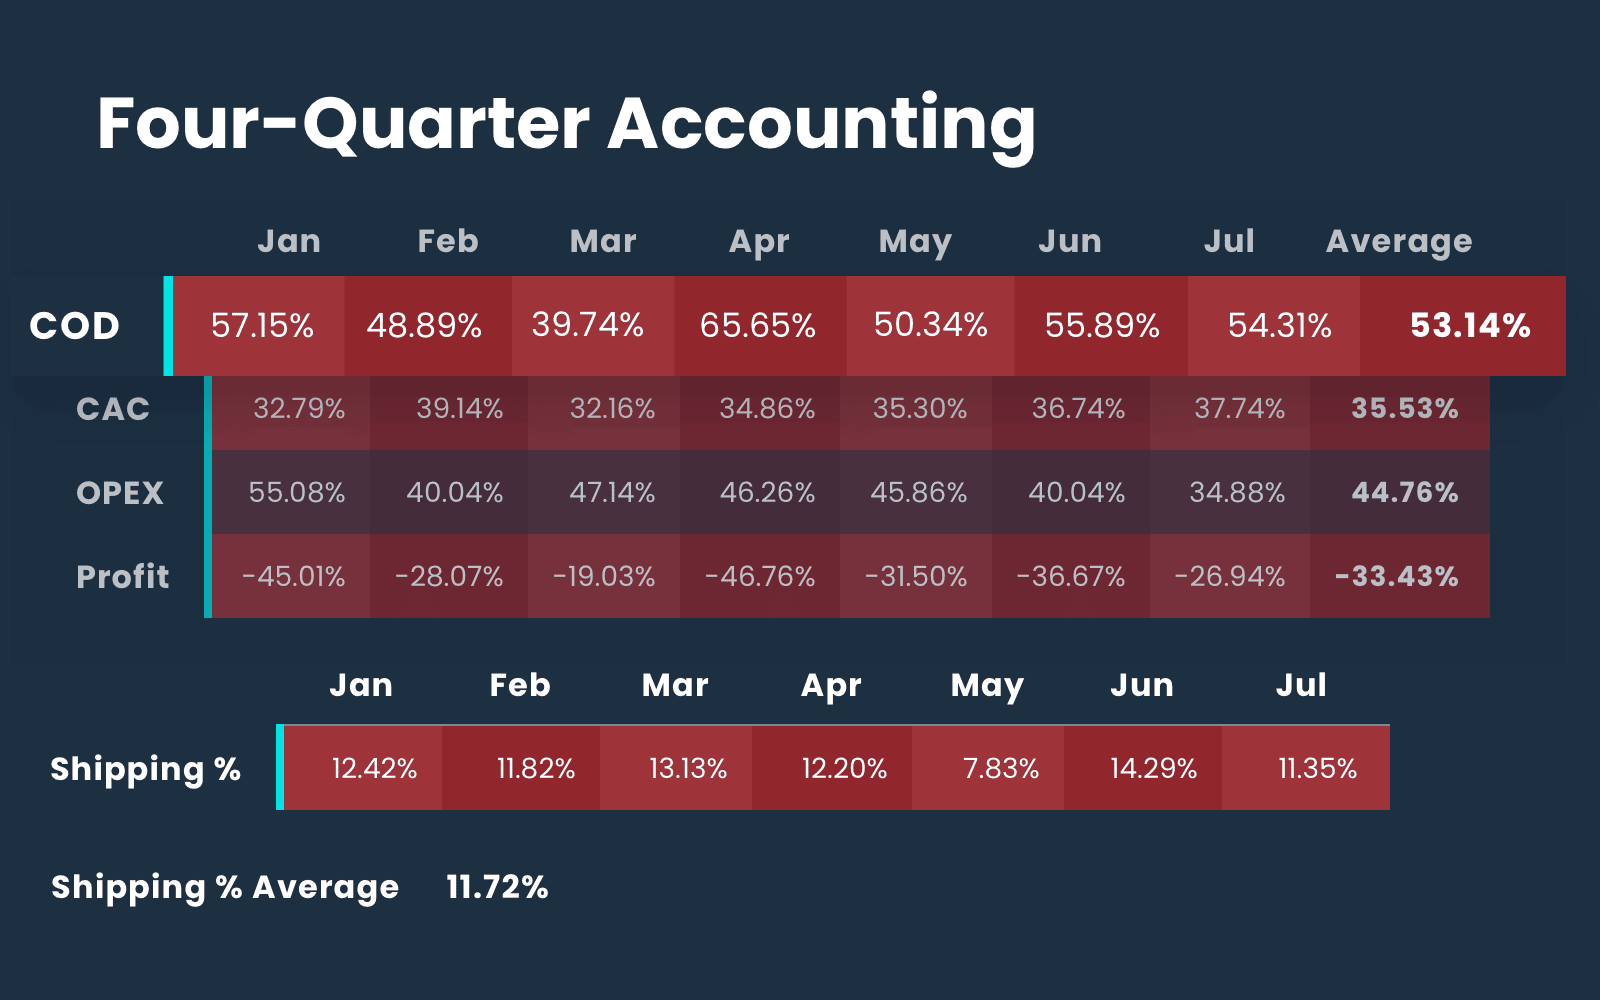
What I want to see for total shipping and fulfillment expenses is a number around 10%. Ideally, this number is less than 10%, but at 11% in this case is again — not ideal, but acceptable.
Moving down the chain, after seeing the cost of delivery is within a reasonable range, customer acquisition cost (CAC) is next.
Customer acquisition costs, or ad spend are the literal dollars paid for performance advertising.
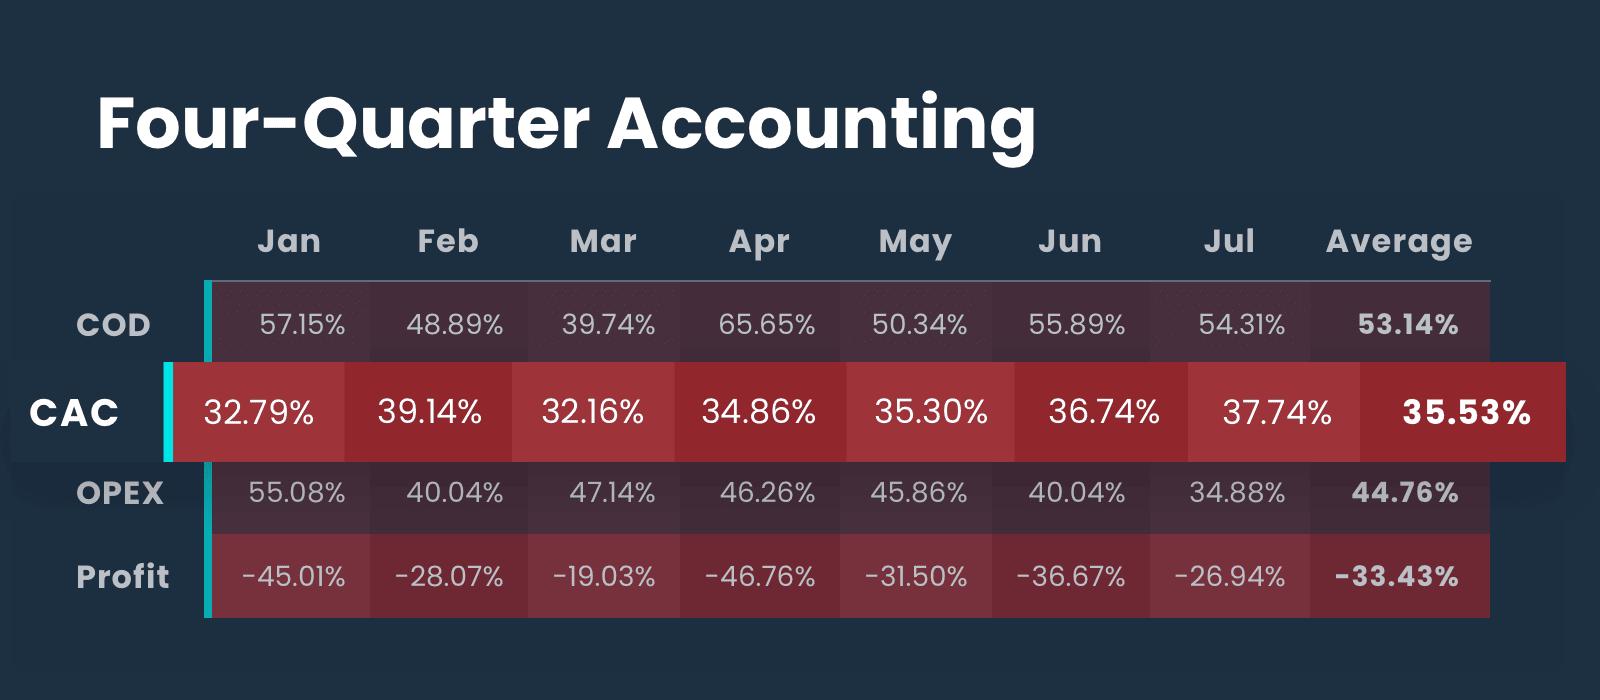
Looking at CAC, I see right away we're at almost 35% of revenue. That's too high for a business at this stage. We need to get that down below 25%.
But is this the most obvious issue?
Operating expenses represent all the fixed expenses that don’t change on a variable basis. These include personnel and payroll expenses, which represent the largest line item here.
Looking at this P&L, OPEX illustrates the most obvious immediate lever point for turning this business around.
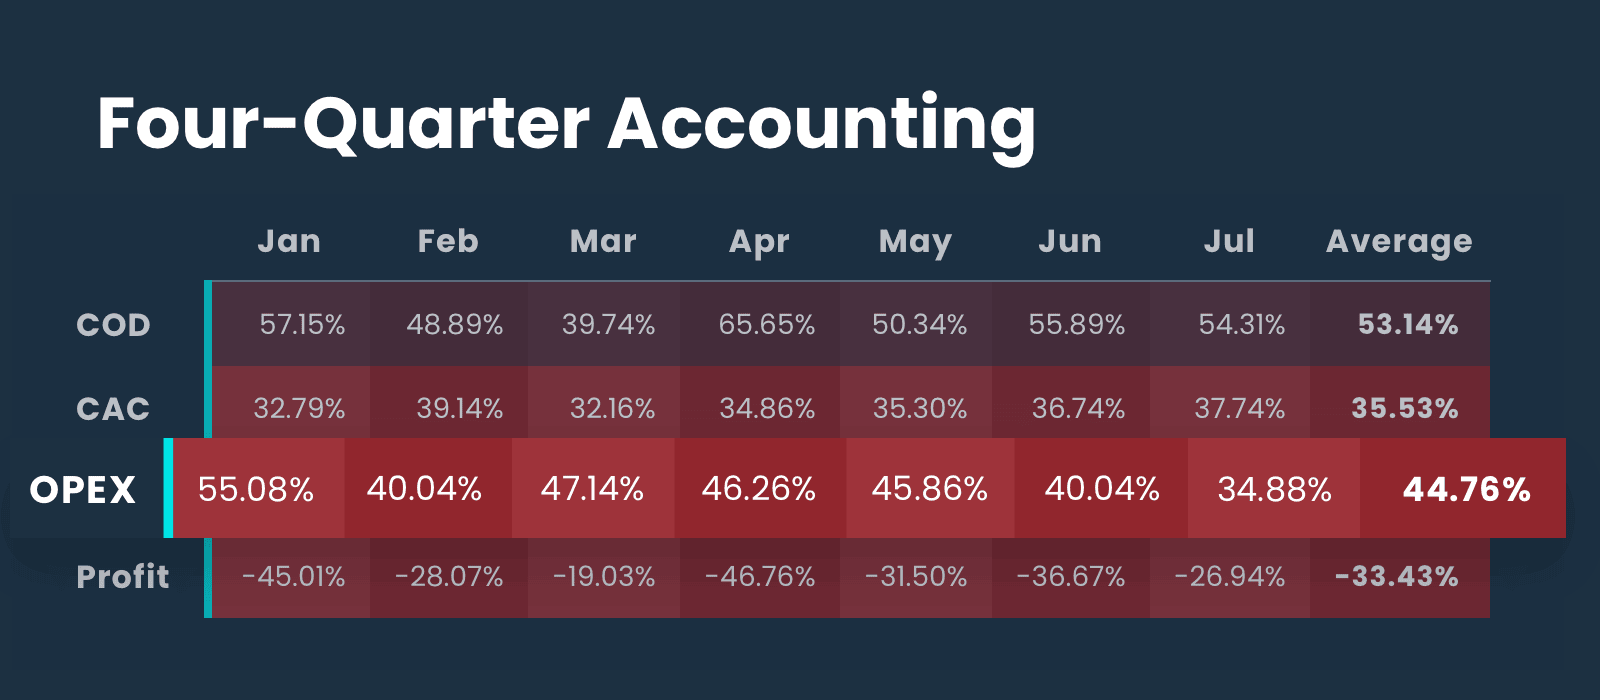
Operating expenses exceed almost 44% on average in this business.
You cannot run a profitable ecommerce business in 2024 with OPEX at 44% unless your product margins are 90%. Because this example is in the apparel industry, that's never going to be the case.
It is an obligation that you find a way to drive your OPEX sub 25%.
As a marketer, if a brand tells me that I need a better CAC or better ROAS because they are carrying an OPEX north of 40%, I have a point to go “timeout!”
This is not an efficiency of acquisition problem. This is primarily an OPEX problem. We have to go solve that.
The leverage point for ecommerce is a lean OPEX.
It's operating leverage on an employee base that can be small relative to the revenue generated per employee. Ecommerce businesses that are driving 20%-30% net profit margins have an OPEX that is <20% percent in almost every case.
So this is a point of leverage where we can bring this insight to the customer and have a conversation, and we can begin to look at the actual composition of the OPEX to see what's happening.
In the very beginning of a business, when you're the one employee and there's no revenue, OPEX as a percentage is going to be disproportionate.
Your percentage of OPEX may be higher earlier in your stage of business when you're not making any money.
This advice applies to eight-figure brands.
The first, and most impactful place to look at cutting OPEX costs is in payroll expenses. Despite the human cost, you still need to live in a reality where the relationship between the headcount of the business and the revenue that that business generates has to be in line.
To get my OPEX total below my target, 25%, my payroll for full-time employees needs to fall below 15% of revenue — closer to 10% is ideal.
Here’s why …
Ecommerce is a seasonal business.
Businesses built around a large headcount, built on full-time employee staffing, should have no variability in revenue or revenue consistently moving up and to the right.
Seasonal revenue, where you see dramatic swings from December to January and June to July, requires flexible staffing to offset the very predictable seasonal dips many ecommerce businesses see.
Focusing more heavily on agencies or contractors allows your business to flex the contract and payments up and down as needed.
Spending almost 30% of revenue on payroll will never work for an ecommerce business. Bringing this number down is a difficult decision to make. And there are usually PTO payouts or severance or other considerations that mean the impact won’t immediately show up in your P&L. But you have to consider it.
You cannot survive and build a profitable ecommerce business at this rate. You're jeopardizing the entirety of the business.
Beyond payroll, another large lever to bring down expenses in this P&L can be found in rent costs, nearly 5% of revenue.
The idea that you need a giant office for a small staff is not real. So what happens when you get lifestyle bloat is you get too many people and you need too much space for those too many people and you've compounded the problem.
If you can’t just opt out of a lease there are other ways to bring this number down. Consider subletting the space, or finding some way to reduce this expense moving forward. This is the benefit of remote work and creates a leverage point on your P&L from an OPEX standpoint.
I've seen a lot of people take on their own warehousing due to expenses.
It is very difficult to take on warehousing effectively and efficiently unless it is a core competency of your organization. It almost always results in waste.
Profit is the final piece in our ‘Four Quarter Accounting’ principle. This is what we’ve been working towards the entire time.
To hit profit targets, there are a bunch of other things that we can nitpick within this P&L. But we don't want to take the responsibility of going through your P&L on a line item basis and saying, “This one, this one, that one …” We simply want to evaluate what’s possible for the future of customer acquisition, based on the profile of your business. In the case of this business, they need to get their OPEX straightened out to be profitable.
Go find the savings.
Our benchmark goal for profit based on Four Quarter Accounting is 25%. Again, a difficult proposition for many apparel brands.
As a marketer, you will never succeed with the cost of delivery at 50% and OPEX at 50%. There's no margin left.
If gross margin as an apparel business is going to sit perpetually somewhere in the neighborhood of 50%-60%, OPEX needs to be lean.
To target 20% profitability, here is how we move forward with this brand:
Through the ‘Four Quarter Accounting’ method, we have given this brand some ideas to play around with. But most importantly, we begin to assess the obligation our revenue has to cover to make profit on the P&L in 30 days.
In previous installments of the Bridges series, we have talked about the relationship between existing customer contribution margin and operating expenses.
This relationship informs how aggressive I can be in new customer acquisition.
Do I have enough existing customer revenue to cover the operating expenses of my business such that I can make a profit?
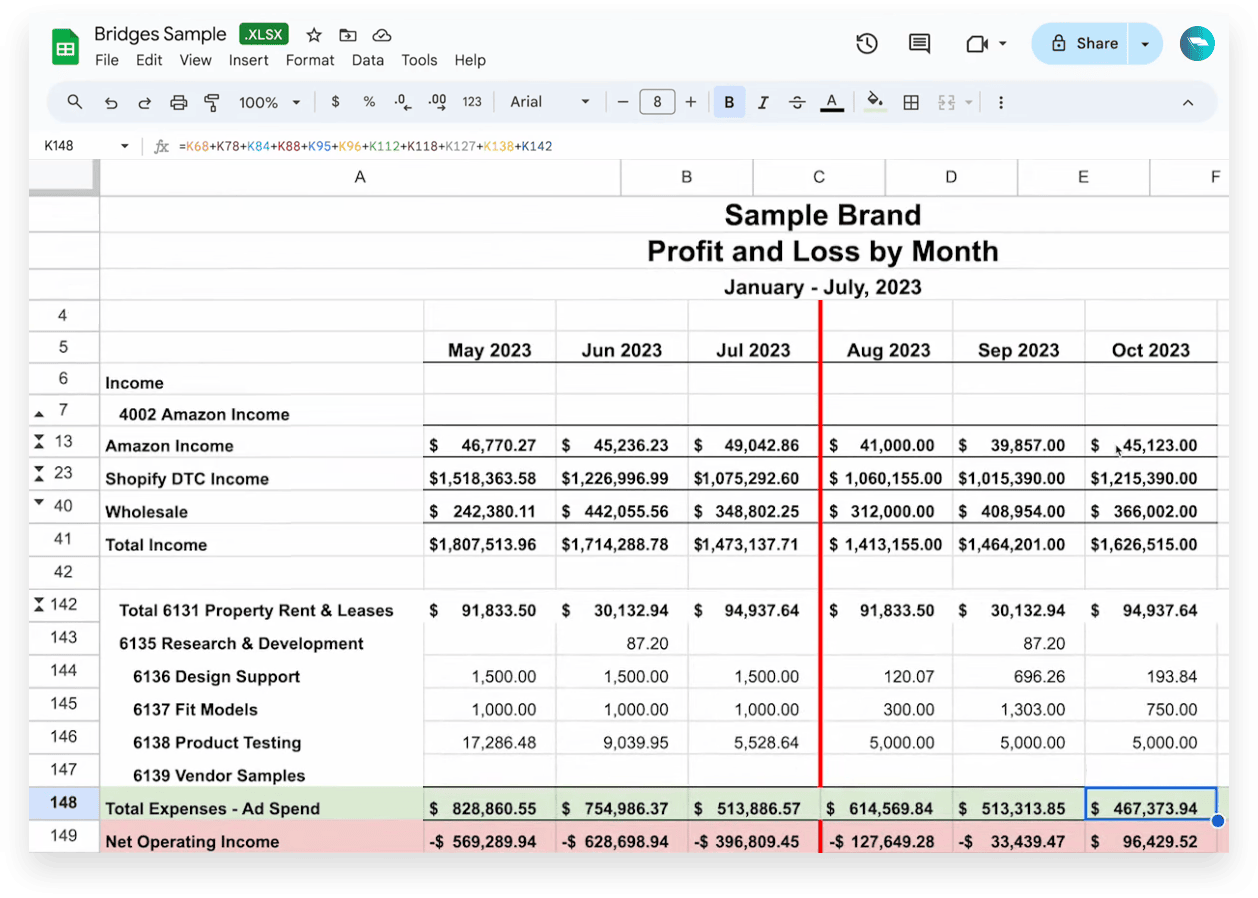
Here, you can see the work this brand did to reduce expenses. With expenses down, from a high of almost $829,000 to $470,000 this month, we’re going to target profitability.
The next piece to examine is the customer contribution margin — that is customer revenue minus the cost of delivery.
Existing customer contribution margin dictates how aggressive I can be on new customer acquisition, while new customer contribution will tell me how much my acquisition efforts are either boosting or eating into my bottom line each month.
With contribution margin in mind, a review of media performance will help determine the next actions necessary to turn this P&L around.
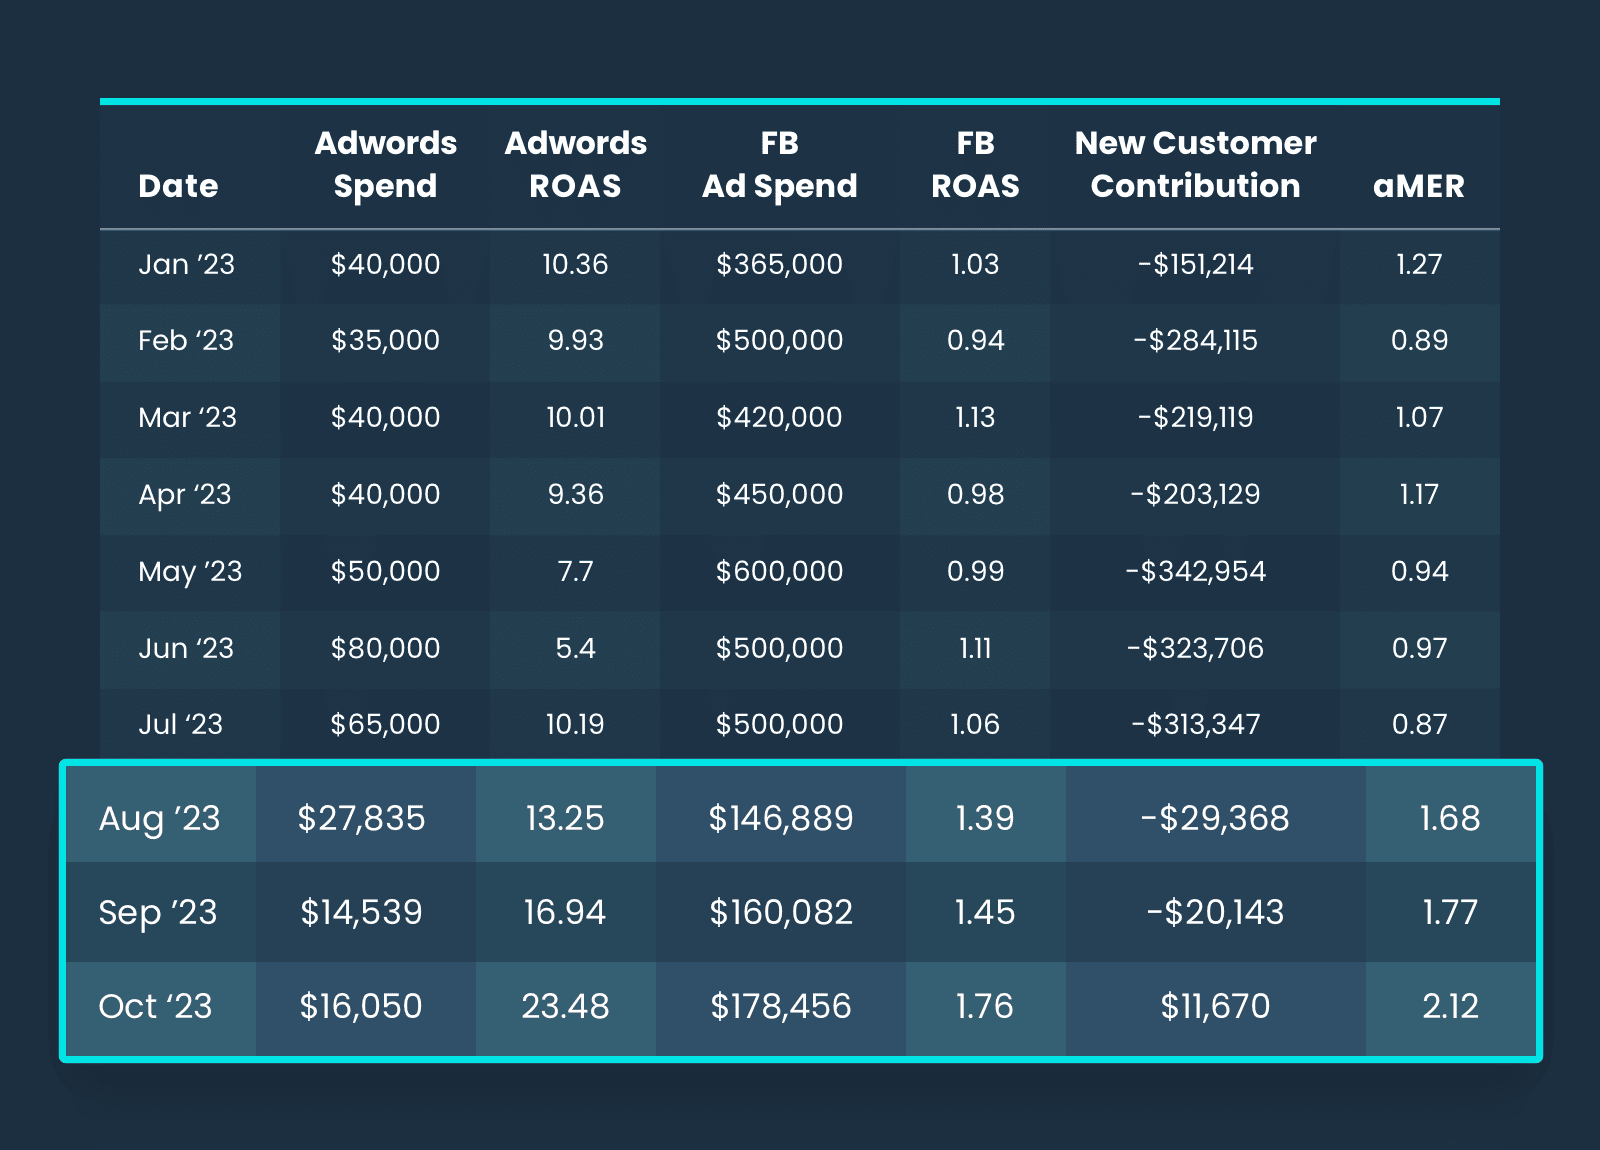
Looking at Facebook spend, this brand is spending almost $500k per month at a seven-day-click ROAS at an average of 1.03. That’s nearly half a million per month at breakeven.
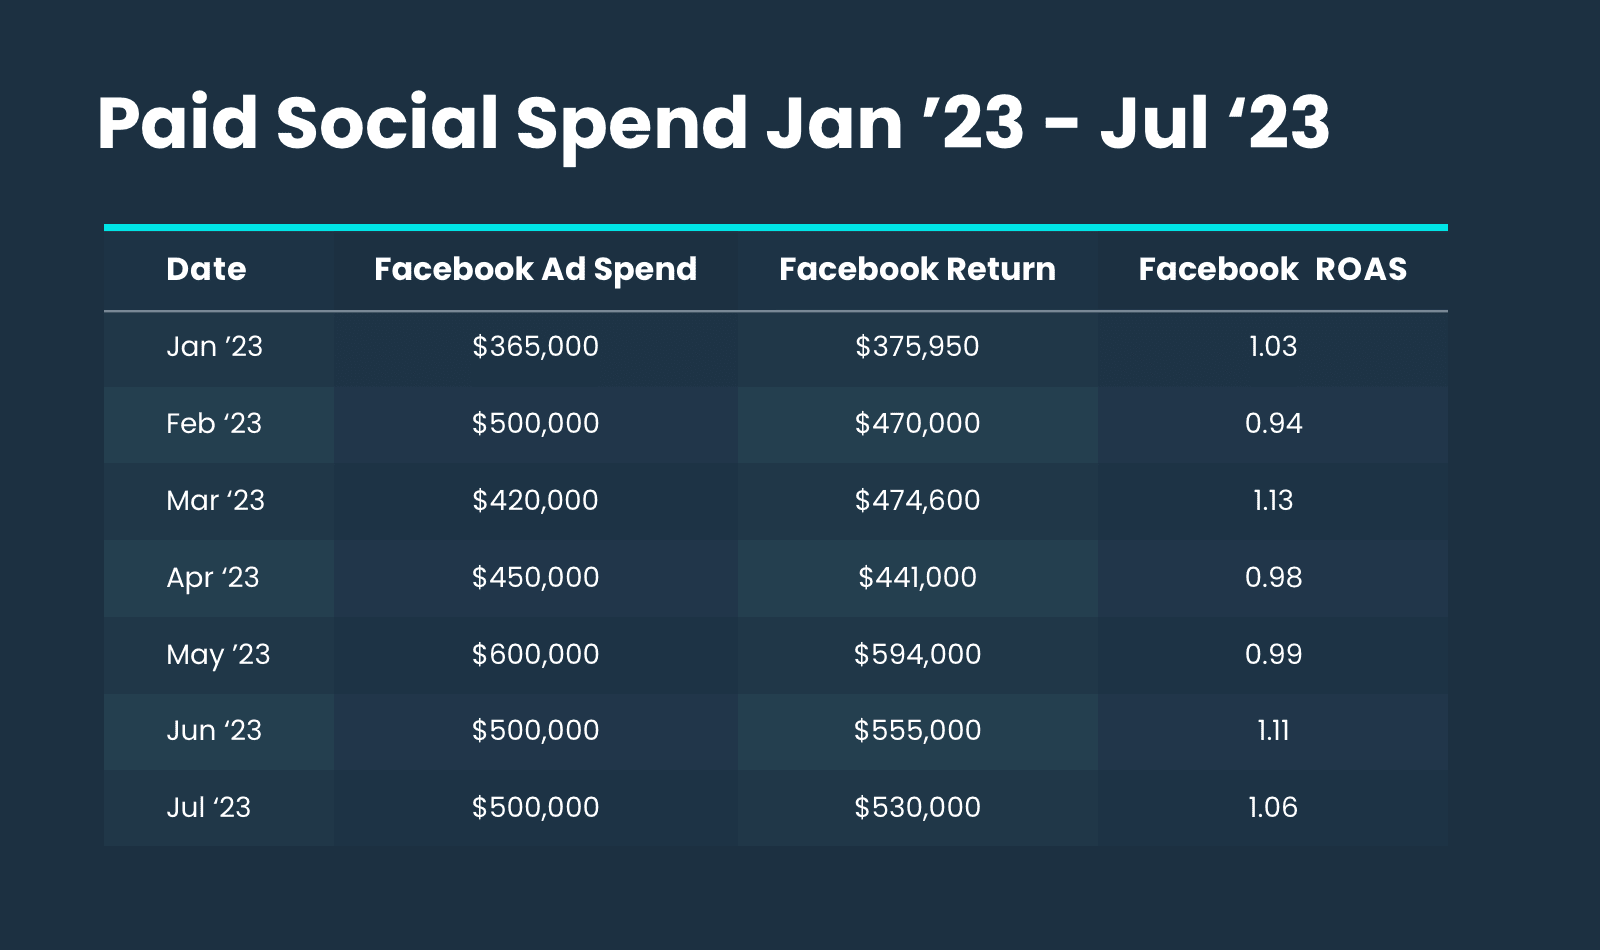
This is where our knowledge of first-order profitability comes into play, revealing just how bad this reality is for our brand.
If you have a 50% cost of delivery and you spend 100% of your revenue on customer acquisition, your business will drive negative new customer contribution margin every month.
With this brand’s current LTV, that means they will never reach profitability at their current status quo.
Do not, as an apparel business, run your Facebook ROAS at a one. You will never make money.
You can see that the paid social spend might drive top-line revenue growth, but the new customer contribution margin every month is deteriorating the total dollars flowing through the bottom line.
One way to notice this is through the correlation between aMER Metaspend. For this brand, there’s a tight correlation there, because all new customer revenue is being generated from Meta (or a lot of it, at least on a reported basis,) but aMER is about the same.
Although it's the most talked-about paid channel for ecommerce businesses, a complete digital marketing plan — one aimed at profit, not just revenue — can’t start and stop at Facebook.
Paid search, specifically Google Ads is another key opportunity to find profitable growth.
We’ve published many other resources to guide you through when to focus on Google ads vs. Facebook ads, Google Shopping best practices, and Performance Max. We won’t dive into all of those strategies here, but we have created a “Search Engine Marketing Order of Operations” to act as a general guideline we use to determine appropriate budgets across paid search.
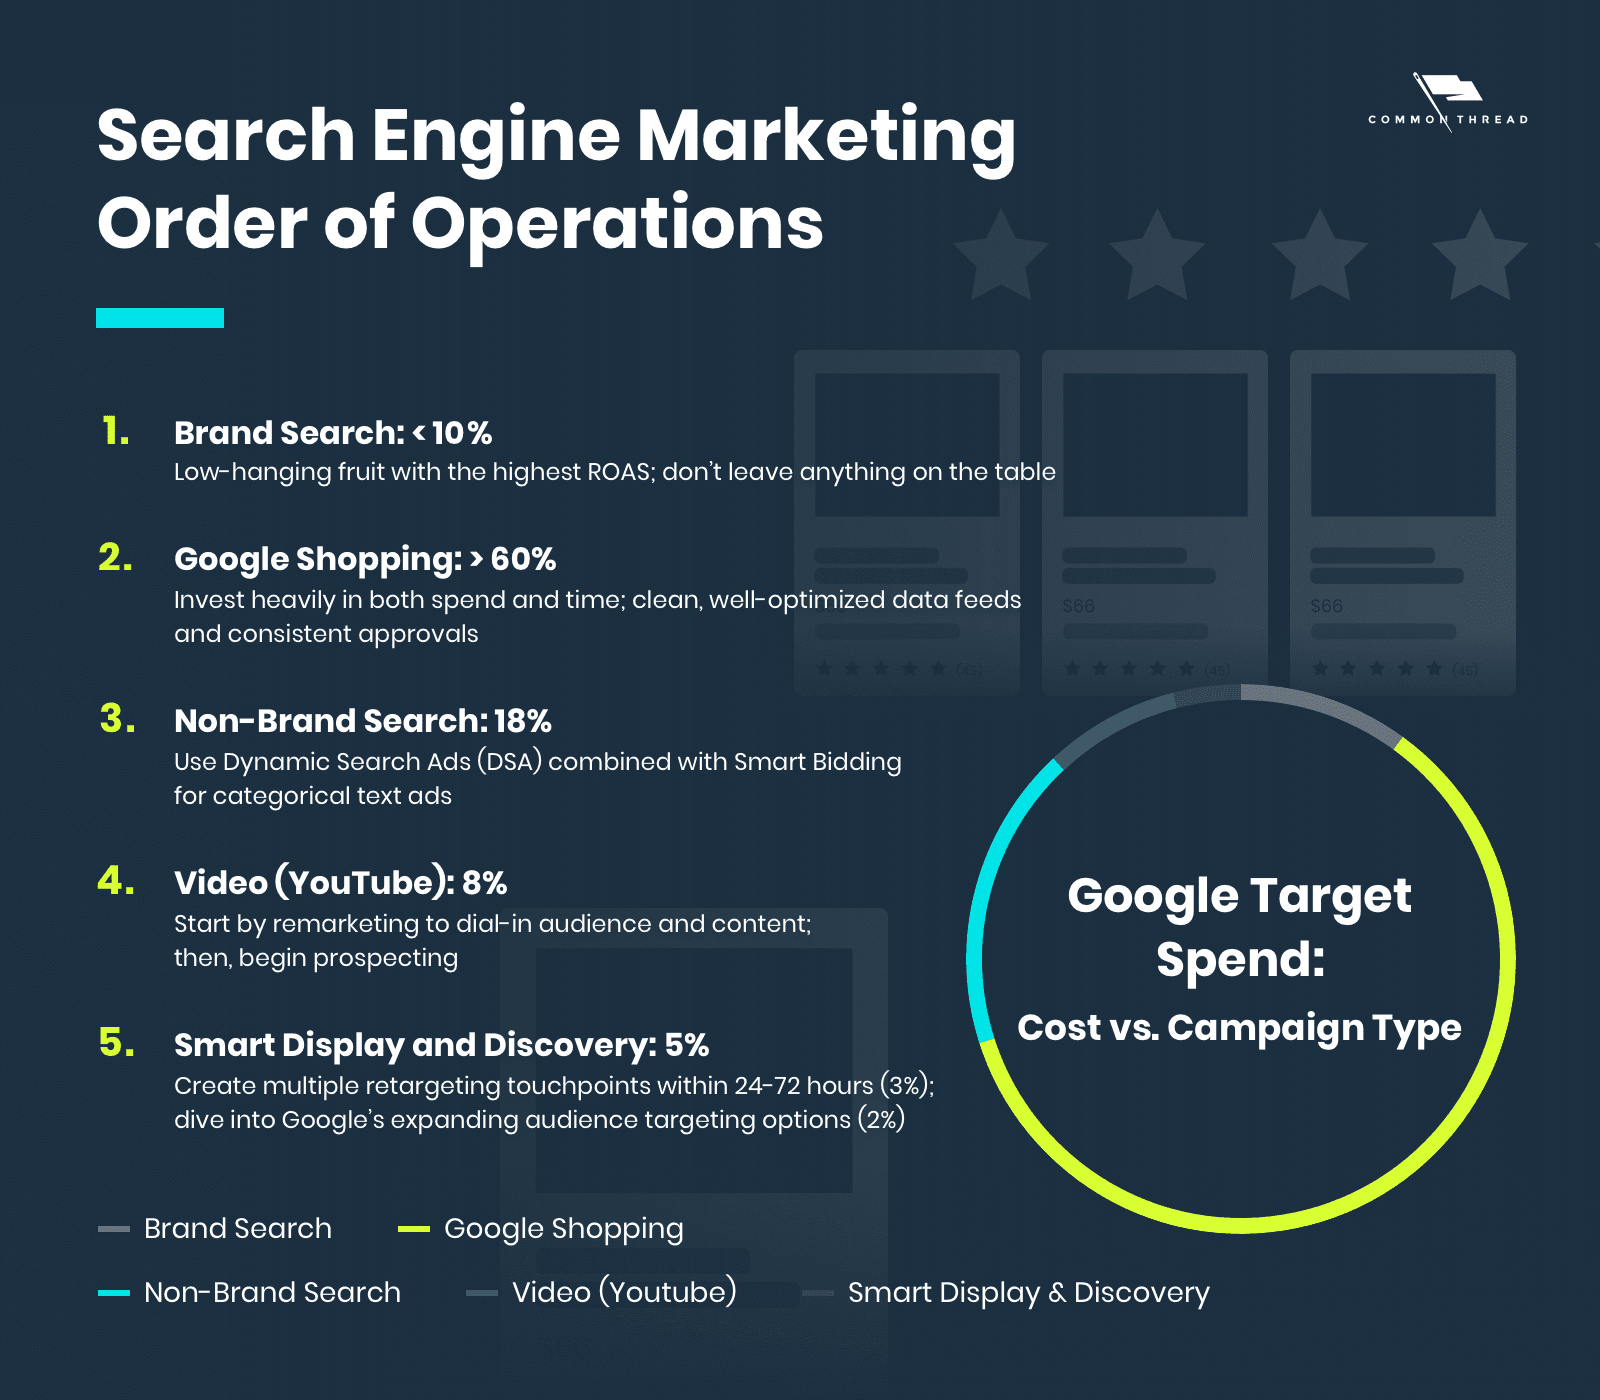
You anchor your strategy and budget in the ‘Search Engine Marketing Order of Operations’
Brand Search: <10%
Brand search is low hanging fruit. Don’t leave anything on the table. Limit to <10-15% of total account spend. Your brand search campaigns should have the highest ROAS in your account.
Google Shopping: >60%
This is where the majority of our time is spent. Target +60% of total account spend. Clean, well-optimized data feeds and consistent product approvals in Google Merchant are the secret to success.
Non-Brand Search: 18%
Use Dynamic Search Ads (DSA) targeting combined with Smart Bidding to get best-in-class results. Search may have a lower return than Shopping due to higher CPCs. Aim for less than 20%.
Video (YouTube): 8%
Begin by remarketing on YouTube to dial-in audience and content. Once the account is healthy, begin prospecting. In other words, pull then push. Mix the two approaches at around 8% of your budget.
Smart Display and Discovery: 5%
Create multiple retargeting touch points within 24-72 hours after someone visits, views products, adds to cart, etc. After that, dive into Google’s expanding audience targeting options. Keep Display Network at 3% and Discovery at 2%.
A look into the numbers for our apparel brand shows an AdWords spend averaging around $50,000 a month.
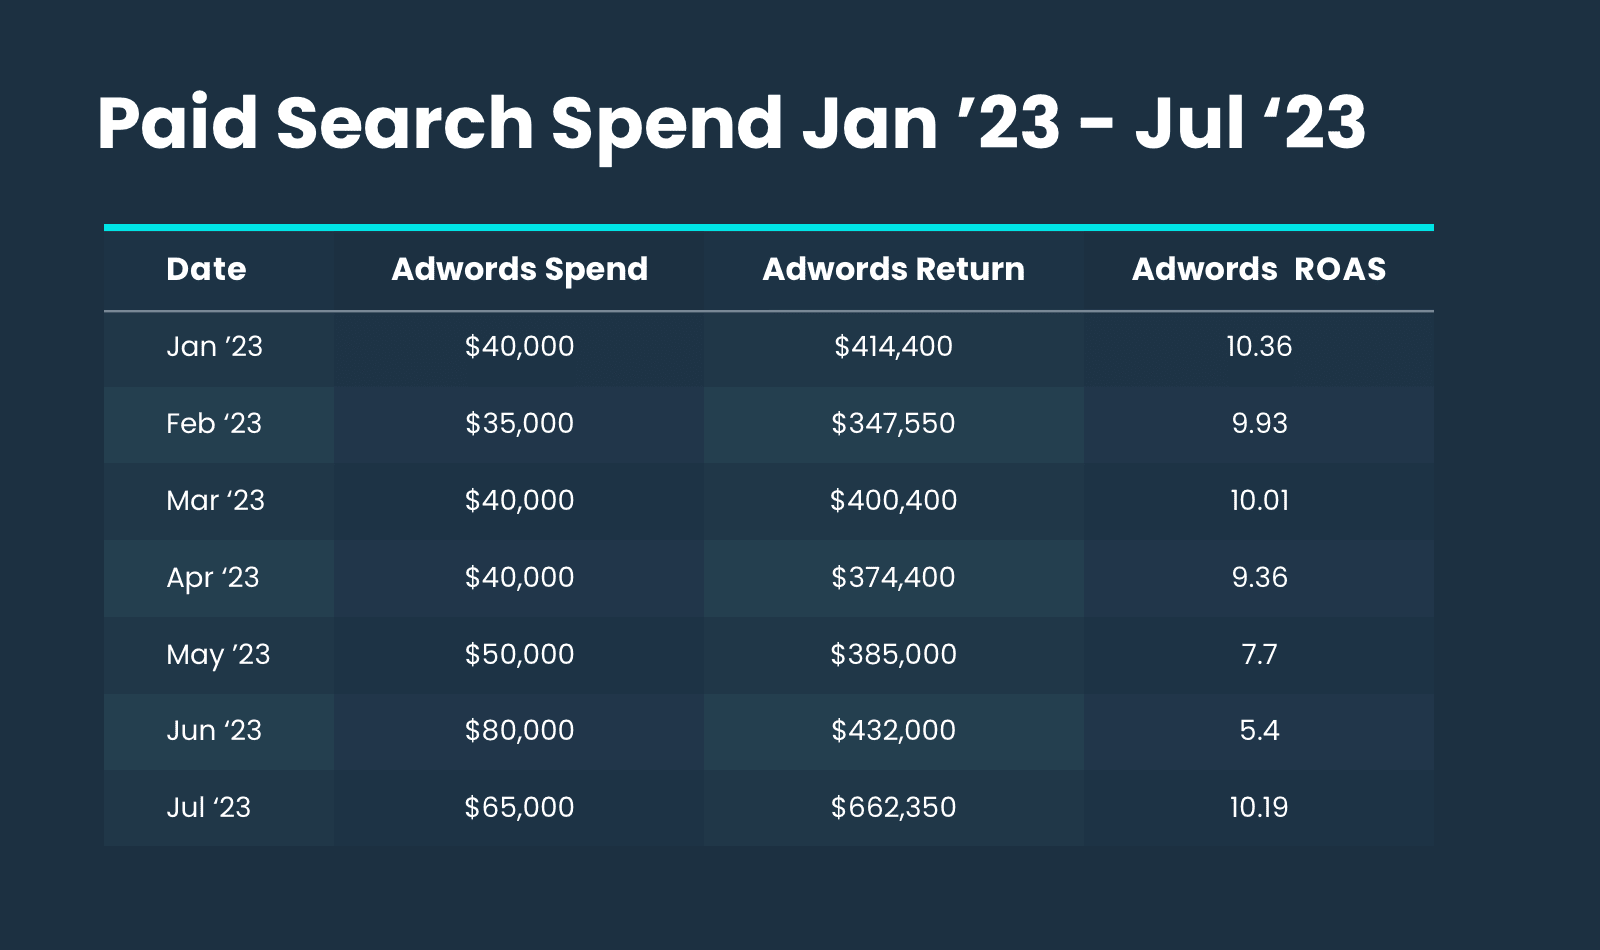
Diving deeper into the paid search numbers, it looks like this channel is seeing a high ROAS inflated by brand search. Per our standards, we want to keep branded search below 10% of our total paid search budget.
For product categories, like this apparel brand, if the bulk of media spend is going toward branded search this ROAS needs to be higher. This brand is spending too aggressively on its own branded terms.
Right now we’re thinking, “timeout, all this money is no good.”
But how good does it need to be in order to become profitable?
The answer to that lies in returning customer revenue, specifically, existing customer contribution margin.
If I need my new customers to generate incremental contribution margin to cover my OPEX, and I have to be first-order profitable, existing customer contribution margin helps me think about how much new customer contribution margin I need to generate.
To isolate returning customer revenue, simply subtract new customer revenue from total revenue. Since we aren’t paying for this returning customer revenue, we can take our returning customer contribution and subtract that number from our overall OPEX to determine the ongoing health of our business.
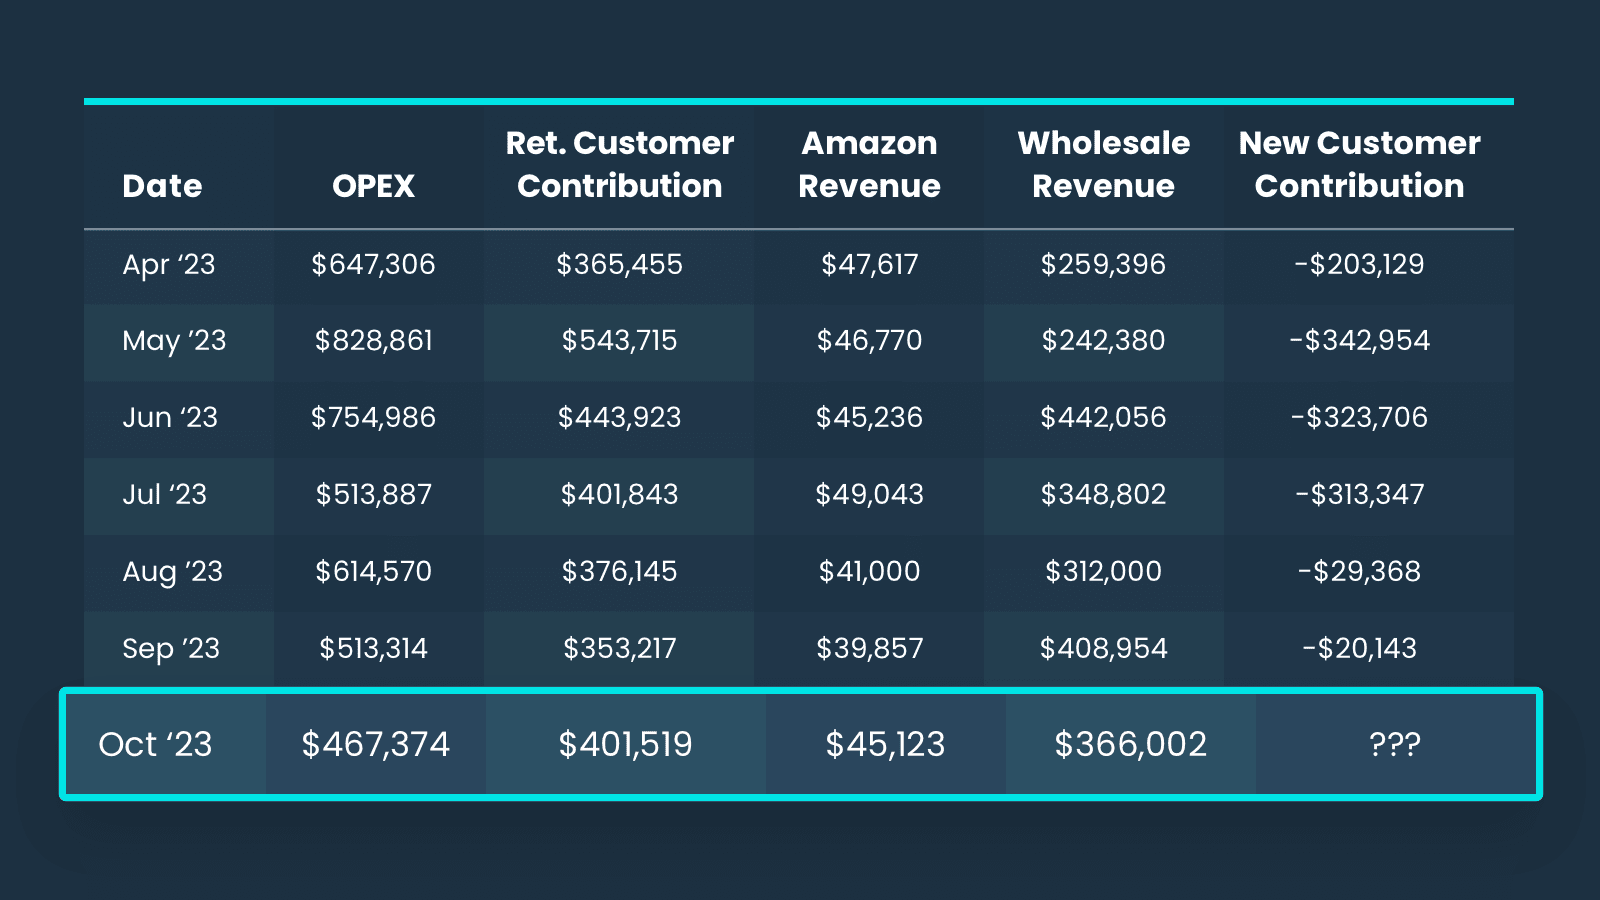
Looking at October, this brand is carrying about $496,000 in expenses. Based on previous months, we can expect about $400,000 in contribution from returning customers, $45,000 in Amazon revenue, and about $350,000 from wholesale. After calculating the contribution on those channels, we’re left with an incremental contribution of around $520,000.
That means existing customer revenue plus these other channels will cover our business’ OPEX.
As long as new customer contribution on paid social doesn’t continue our trend of deteriorating the bottom line, we know this brand can make some money.
Despite a recurring bottom-line cost of nearly half a million per month, this business can become profitable.
How do we achieve profitability?
Our immediate action for this business was to cut spend dramatically.
We went from spending almost $55,000 per month on AdWords to $27,000 a month on Google. Continue to drive that number down, increasing efficiency on AdWords, tightening up the cost-per-click models, and ensuring that ROAS remains high enough to warrant spend.
Same thing on Meta. Introduce cost caps. Audit targeting a seven-day click of break-even after accounting for cost of delivery, so roughly a 1.5 target Facebook ROAS.
That 1.5 ROAS will conservatively get the business to a break-even aMER.
That break-even aMER will get us the rapid growth this brand is looking for while maintaining profitability rather than a continual burn.
Are you struggling to set a proper budget for your Facebook ad campaigns?
Many advertisers make the mistake of spreading their budget too thin across too many ad sets and campaigns, which can hinder their success. Others (like this brand) simply spend too much at a loss across meta.
Learn how to avoid common ad budget mistakes, and set up your budget correctly to maximize your advertising efforts on Facebook.
Within three months of driving spend down, bringing Facebook ROAS up, and ensuring first-order profitability, this brand goes from losing $300,000 on new customer contribution margin to making money with new customer acquisition.
There was so much waste and inefficiency in the ad spend, trying to drive top-line revenue growth. Every dollar spent deteriorated contribution margin further and deteriorated the P&L.
This business never had to be unprofitable.
It always had the underlying potential for profit, and now the job is to see how much incremental spend we can stack while holding this rigorous, diligent constraint of aMER.
At 50% gross margin, we need a two-to-one aMER to be first-order profitable. To continue to scale, this business either needs a continually leaner OPEX, or an ongoing returning customer contribution margin exceeding operational costs.
But we want to grow the business, right? We're not trying to just go backward.
So, the move is to generate returning customer contribution in excess of $400,000 and continue to grow wholesale and Amazon along the way.
New customer contribution becomes a positive, additive part of the business.
Everything else, in turn, connects back to existing customer revenue: the relationship between how to plan OPEX, when to hire, who to hire, what investments to make, when to test new channels, when to invest in R&D, or when to get a new office.
It's all related to the growth of the existing customer revenue.
Now, as the marketing team forecasts the plan and begins to model for the future, you can plan the growth in the investment in the business alongside the cash flow, because we are no longer wasting money.
And just like that, a brand that lost millions of dollars in the first six months can turn to profitability.
A new period of austerity will get the business healthy enough to develop the muscles for driving profitable new customer acquisition. That becomes the governing principle that leads the organization.
This is why cost controls become so critical — they ensure you don't waste when you don't have the money to waste.
This business does not have another fundraising round. There is no bank debt available because your TTM EBITDA is a disaster. If you add in revenue-based financing, you aren't likely going to be able to produce enough free cash flow to even pay off the interest rates.
Not yet. Maybe soon.
This is a really freaking good business. They have done something awesome and it's exciting to be a part of, because they don't have to live in the tension and anxiety of losing so much money.
Strategic changes not only achieved immediate profitability but also laid the groundwork for sustainable growth.
The turnaround story of this apparel brand serves as a compelling testament to the power of strategic financial and marketing collaboration.
As a marketer, I now have the confidence to say …
I'm not going to be given an objective for CAC built to cover for the sins of the OPEX.
If you, as a marketer, can provide guidance, coaching, and support on how to think about spend and why and how we help get the business to growth, your relationship with the finance team and the CFO goes through the roof. Your decisions will be directly tied to the business’ financial objectives.
Ask for the P&L, break it down using Four-Quarter Accounting, and use existing customer revenue to inform new customer acquisition targets.
Go save every dollar, so you can put it into the acquisition of new customers. Because the more new customers acquired at break-even, the faster your existing customer revenue grows, and the more you can grow the entirety of the business.
This scenario happens all the time in our industry.
Reset the top-line and rebuild profitably such that in 18 and 24 months you’re going to have an amazing business.
Marketers and finance people need to work together!

We’ll work with you to custom-build CTC’s predictable, profitable growth system for your ecommerce business.
Get Started