Implement the Prophit System for Your Brand
We’ll work with you to custom-build CTC’s predictable, profitable growth system for your ecommerce business.
Get Started

by Taylor Holiday
Jan. 18 2024
Top-line revenue targets are killing your ecommerce business.
That’s a bold statement, I know. Before you dismiss my claim, let me walk you through the most common problem I have seen preventing many ecommerce brands from achieving predictable, profitable growth.
Your marketing team has been chasing — and hitting — a top-line revenue goal. So why is your profitability plummeting, despite the upward trajectory of revenue?
Many brands find themselves caught in a cycle of overspending to boost revenue, leading to a detrimental impact on new customer acquisition costs.
You don’t need revenue, you need profit. Here’s how you get there.
This blog post is a part of our “Bridges” series, which aims to bridge the gap between marketing and finance.
In this era of ecommerce dominance, understanding and impacting the financial outcomes of your business is more vital than ever.
First-order profitability stands as a fundamental metric for any thriving ecommerce business. Let's break this down using a concept I like to call the "waterfall chart."
This visual helps to show what we're after, which is the ability to produce contribution margin or dollars in your pocket after a consideration for all the cost variable expenses that come out of each order you receive.
You can do this on a per-order basis, or you can do this by looking at overall first-order revenue minus all of the actual dollar expenses to determine how many raw dollars of first-order contribution you're generating.
In the example below, we’re calculating overall (average) first-order revenue.
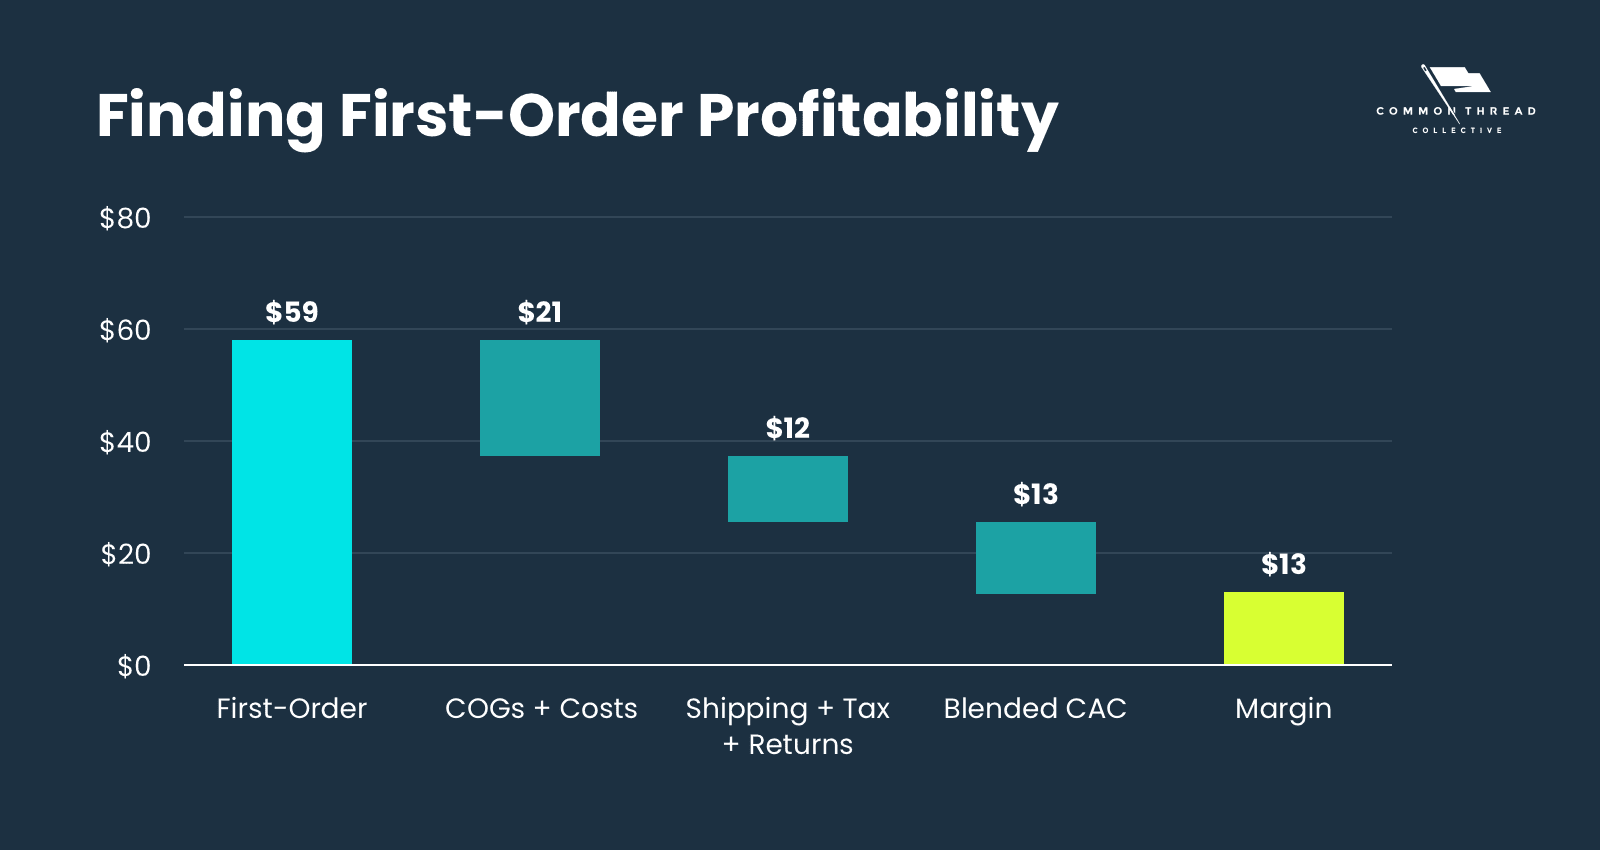
So in this case, what we're illustrating is that if you have a first-order revenue of $59 and you have COGS (product costs) of $21, then you subtract all other variable expenses to find first-order profit.
Only include the variable expenses when calculating first-order profitability.
Our first variable expense is Cost of Goods Sols (COGS) or as we like to refer to it, Cost of Delivery. Referring back to our previous installment in the Bridges series, we break down everything that's included in the cost of delivery: shipping and fulfillment, merchant payment, processor fees, returns, taxes (if included in the first order value), and all variable expenses.
Then subtract your blended cost of acquisition, all the dollars on a per-order basis that go into acquiring new customers. What's left over, if any dollars at all, is referred to as first-order profit. You'll often hear the phrase also first-order contribution, and it is simply an attempt to illustrate how many dollars end up in your bank account after all variable expenses are paid on a per-order basis.
The reason you don't want to include fixed expenses in this specific calculation of first-order profit — and this is really important — is that fixed expenses vary in terms of their amount based on the total amount of revenue that you generate as a percentage of that overall revenue.
So as an example, if I have $10,000 in fixed expenses and receive 10,000 orders, that would be $1 per order that would need to be included in this chart. But, if I receive 20,000 orders, then suddenly that percentage decreases to 50 cents.
You actually can spend away from fixed expenses, and so we want to separate them out in the consideration of this process.
This visual, while a great starting point, only looks at your averages. Average first-order value, average blended costs, average blended cost of delivery, and average blended CAC. It can help determine how far you presently are away from first-order profitability, or how first-order profitable you are, but it cannot reveal any major problems.
Either way, it's going to give you the blended overall outcome of your new customer acquisition. And it's an important point of view to have. It's a great starting point for illustrating and thinking about, “What should my blended CAC be against the first-order value to generate margin?”

In this case, what it illustrates for us is that we could go up to $26 in a blended CAC and still achieve break-even or first-order profitability. $25 would be the maximum new customer CAC that we could afford to achieve first-order profitability.
Now you invert that to an aMER calculation, which is just the order value over the CAC, right? And you get roughly a two-to-one, about a 2.27 aMER that would be required to be first-order profitable.
Now, that number becomes an anchor point to build your media acquisition plan against that you can begin to decompose into a channel-specific set of targets.
Before we actually set targets in meta, and leverage cost controls to ensure we're protecting against first-order profitability, we need to talk about the insidiousness of averages and why you must begin to think about order values — independent of averages — to protect first-order profitability.
Averages can be misleading.
Relying on average order value (AOV) and costs may lead to skewed decision-making, particularly when these averages do not represent the actual distribution of customer purchases.
Remember, your AOV is a combination of purchases from the existing customers that you have, as well as new customers across a large distribution of individual orders.
There's this great saying in mathematics …
There is no one measure of central tendency that is best, but using one is certainly worst.
To understand the impact of this saying, you need to understand what we call an AOV Histogram, a distribution of order values to help establish efficiency targets and expectations.
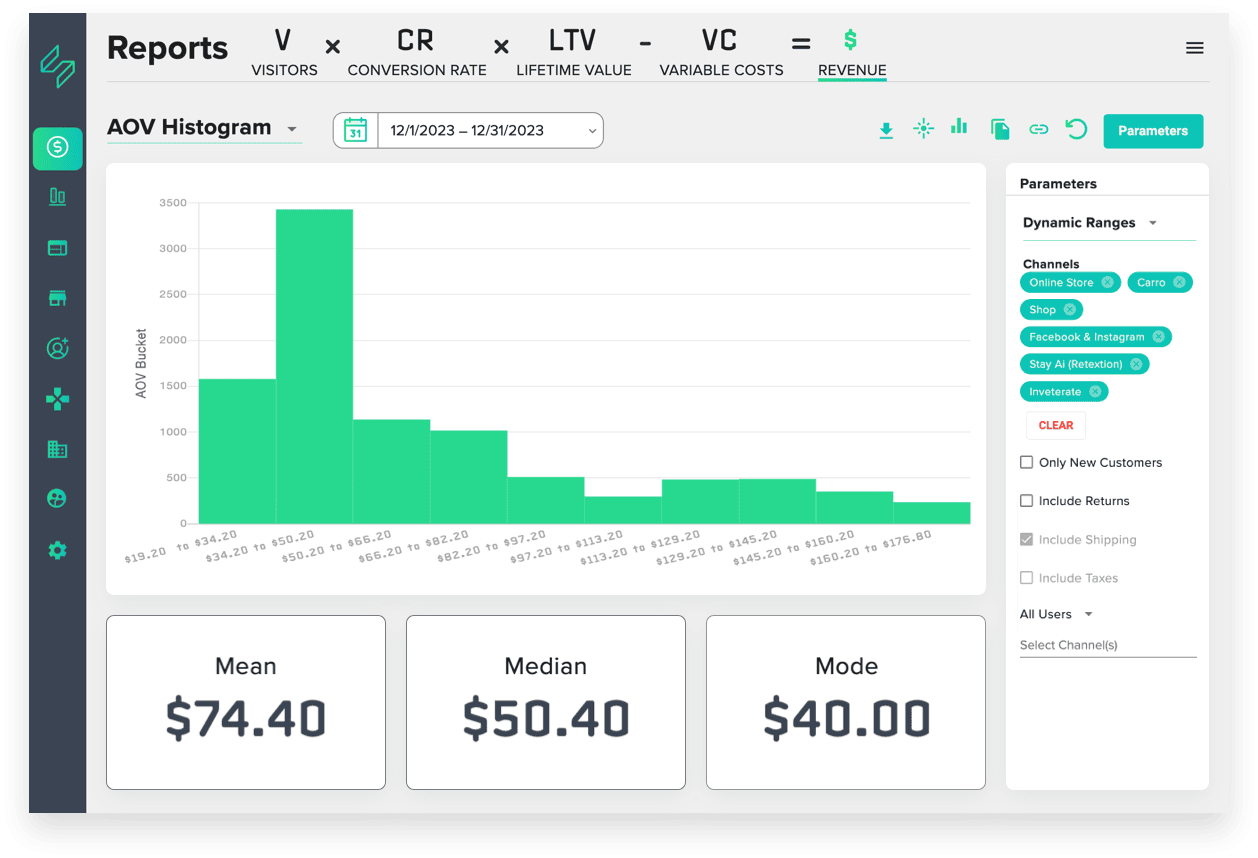
Referencing the dataset above to set a new customer acquisition target at a 70% margin against the AOV of the entire business at $74 could lead to real trouble.
A quick calculation on 30% of our $74 AOV, yields roughly about $50 of margin remaining.
Sounds good, right? Wrong.
Watch what happens when I isolate this data to only show me the values of new customers …
Immediately, the average is much higher. New customer AOV jumps to $88.98, but even that hides something really dangerous.
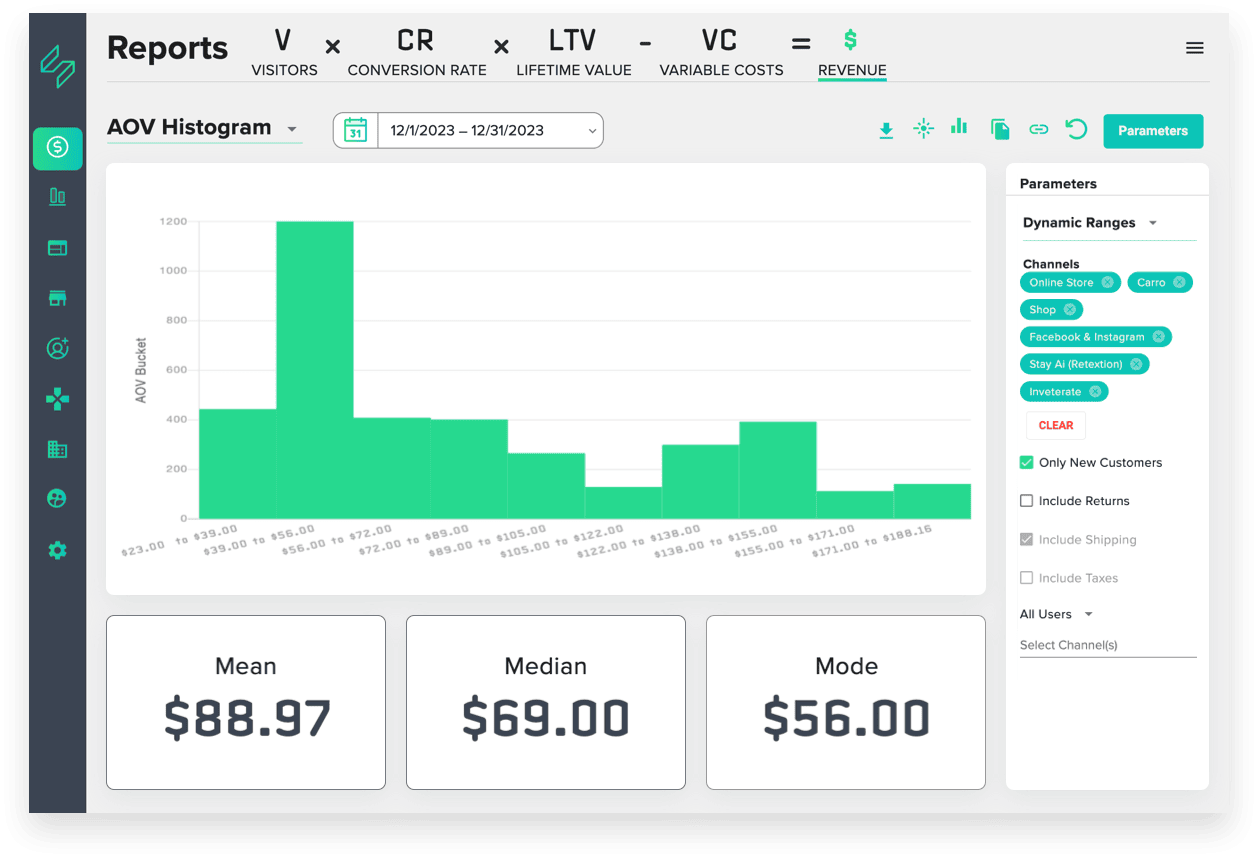
This distribution is what's called left-skewed, meaning that relative to the average, a majority of orders fall left-of-center on the chart. Assuming the mean is in the center of our histogram, you can see the data is distributed heavier in terms of the volume below our mean order value of $88.98.
The data is also somewhat bimodal, in the sense that two peaks represent the bulk of the orders, and yet none of them are actually in the mean range.
This is where it's really important to introduce a much more common view of your order value, modal order value.
What is the most commonly occurring order placed by your customers, particularly new customers?
Taking that a step further, let’s examine order count by each range listed in our histogram …
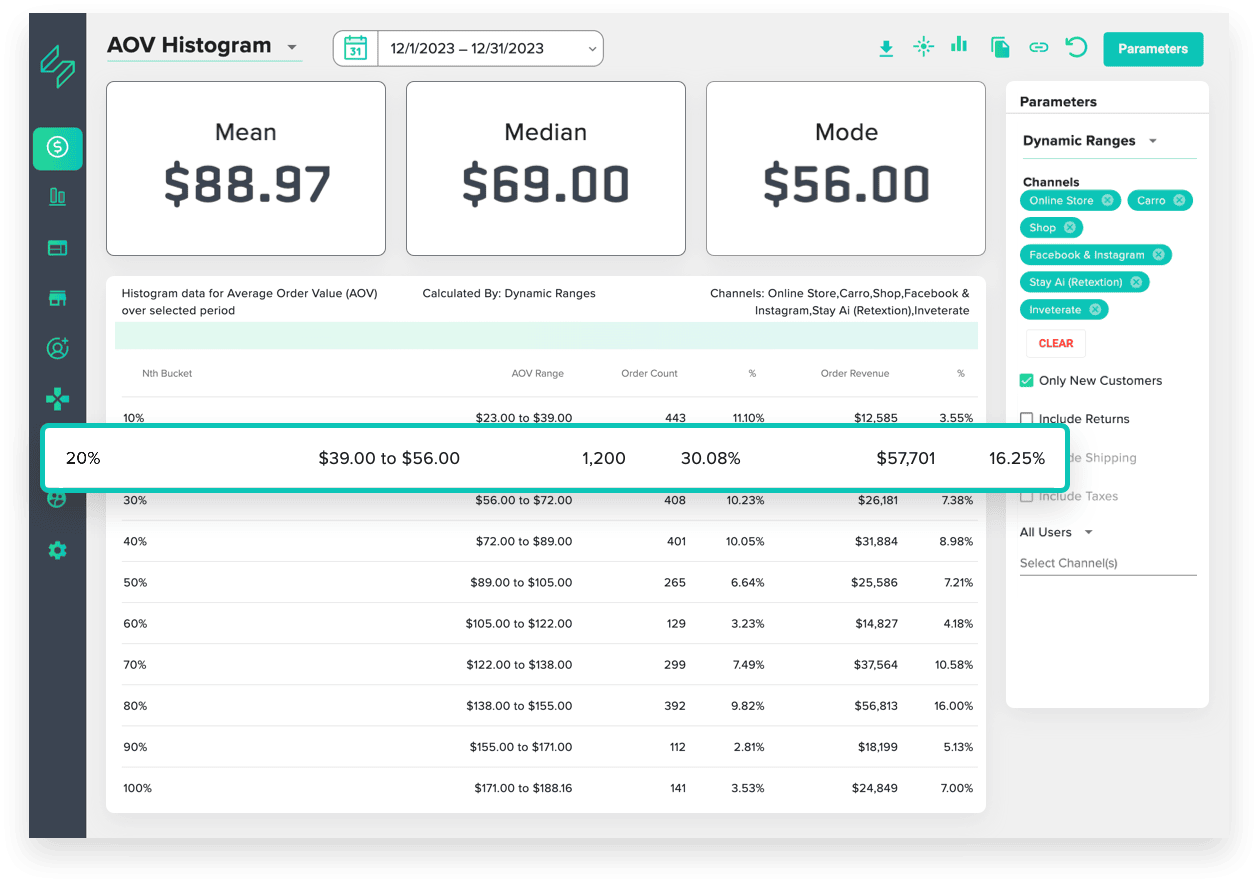
In our example, the range from $39-$56 represents almost three times as many first-time order values as any other purchase.
Think about how dangerous this is, if I used my initial new customer AOV ($88.98) to set my CAC target, to set a bid cap, and to set a cost cap.
Most orders would be occurring at a value substantially lower than that average order value. Using that initial AOV, $88.98, with my initial two-to-one acquisition target, would result in roughly a $44 CAC target for this $88 in revenue.
The reality, with most orders occurring at $56, would mean a massive margin loss at that modal order value.
You can't just look at averages.
You have to truly understand the value of your funnel when running paid media, not just for new customer acquisition, but for every acquisition channel you're running.
Don’t just look at your average order value, but evaluate the distribution of orders coming from the entire funnel that you're running.
Ideally, you can isolate that acquisition range to the smallest band possible, because that allows you to appropriately actually set a CAC target or a revenue value target for those orders.
This is why brands, will often use locked-in landers with a specific offer the customer can't deviate from … so they can isolate exactly how much revenue they're generating per order.
When we ran Qalo silicone wedding rings, people either bought one wedding ring for $20, or two wedding rings for $40 — setting our AOV around $30.
There wasn't actually a way to comprise the orders to get to this average order value of $30.
So if we built acquisition targets, CAC targets, or even aMER goals with the idea of using $30 and then therefore a $15 CAC, what we'd be doing is making most of our orders unprofitable.
And so this is the first part of the insidiousness of averages on the revenue side. But it's not just the revenue where blended numbers mess you up. It's also on the margin side.
The issue with using a blended average cost of goods is similar to the problems we face with blended average order values in setting CAC targets and achieving first-order profitability.
Here's a very simple illustration of this problem using a real client example …
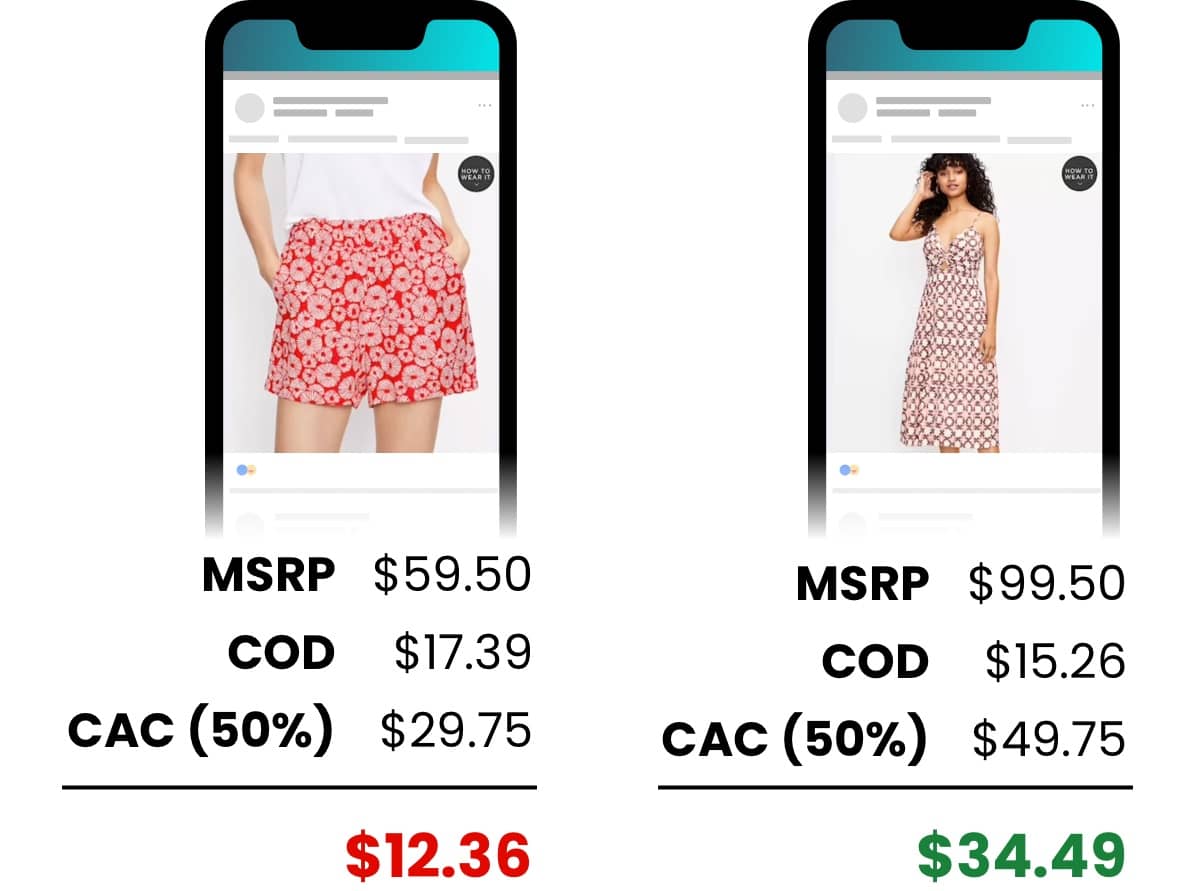
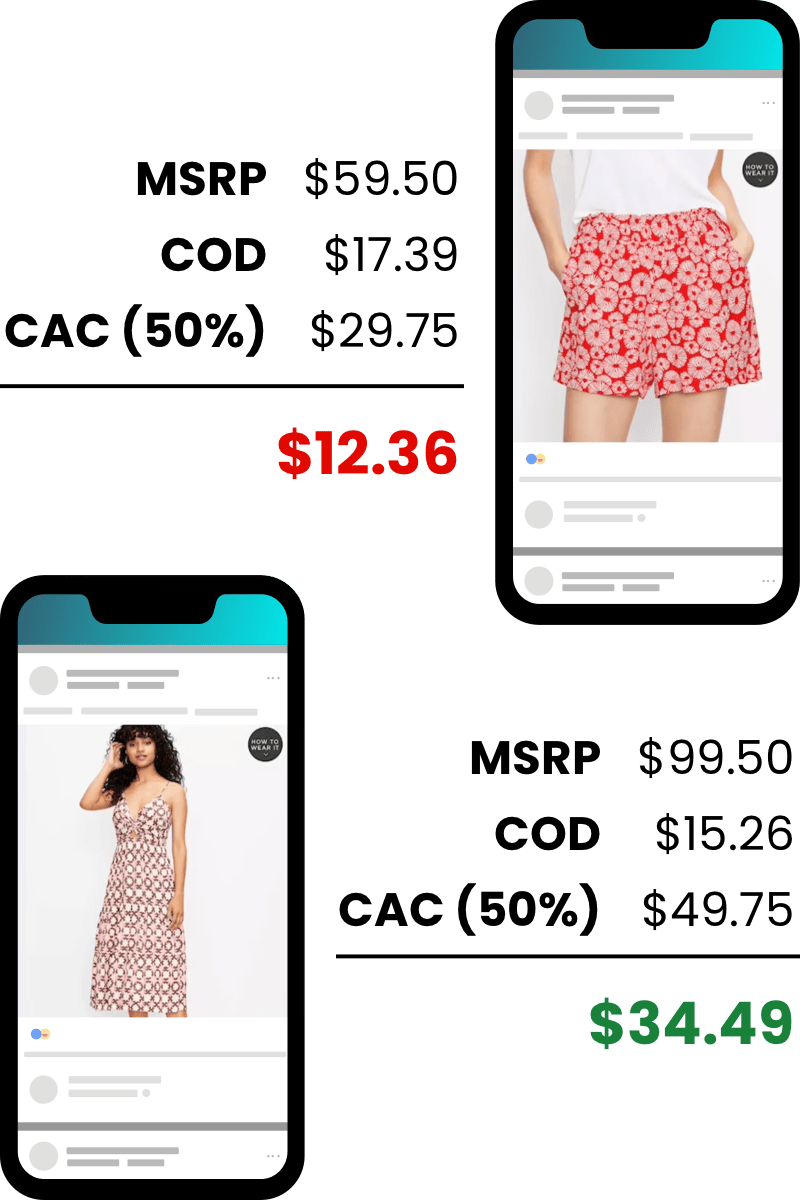
Let’s say we have an account with two products, a pair of shorts with an MSRP of $59.50, and a dress with an MSRP of $99.50.
With a cost of delivery (COD) all-in of $17.39 on the shorts, and a similar COD of $15.26 on the dress, assuming the same cost of acquisition in an account targeting a two-to-one ROAS, the returns for both of these items will be drastically different.
In the case of the shorts, the $59.50 minus the cost of delivery at $17.39, minus the two-to-one ROAS or the 50% CAC at $29.75 equals $12.36 in contribution from that sale.
Similarly, if I sell this dress at $99.50 minus the cost of delivery at $15.26, minus the two-to-one ROAS or the 50% CAC at $49.75 equals $34.49 in contribution from that sale.
I make almost three times as much money.
This drastic difference in contribution comes from the dress having a much higher margin, both on a percentage basis and a gross dollar basis.
But, when I put both of these products into the same campaign in Meta and run them at the same efficiency target, optimizing for lowest cost (for most brands, the default optimization setting) the ad account isn’t optimizing for my contribution margin.
Meta will not drive the highest order value or the highest margin value, but the lowest cost of acquisition.
Which of these CACs is lower? Obviously, the shorts are a substantially cheaper CAC.
Based on the lowest cost optimization, Meta will push harder on the shorts, eating into your contribution margin, and never deliver your higher-margin product.
This happens all the time. And in many cases, the actual margin profile makes it so that this acquisition contributes a negative margin, but our higher-margin product never gets delivery based on your optimization settings.
Setting up specific funnels with defined order values against specific offers with a defined margin profile, a specific corresponding CAC target, and a bid cap or cost control, begins to be the mechanism by which you assert and create first-order profitability.
When you lump it all together and you've set an efficiency target with a bunch of SKUs with variable margins and variable order values, the blended return means that there are a lot of orders that are not profitable.
Now, this is all of the mechanics that begin to hide and complicate the process of first-order profitability.
But it's even worse than this.
When we think about forecasting the overall business, I want to talk about the relationship between this first-order contribution and the new customer revenue versus existing customer revenue against the entirety of your P&L.
In our last Bridges post, we talked about the relationship between your contribution margin and your operating expenses.
Simply stated, if your contribution margin exceeds your OPEX, the delta between those two numbers is profit. But if your contribution margin is less than your OPEX, you will generate negative profit.
So now, if we take this idea that we discussed last time, why contribution margin is such a great signal for profitability and its relationship to OPEX, what we get out of this is an ability to start to think about how much new customer contribution margin we need to be able to generate for profitability.
And it begins with actually thinking about and modeling your existing customer contribution.
The goal is not just to optimize ad spend but to align it with first-order profitability.
This involves a deeper understanding of customer acquisition costs and the efficiency of ad spend. The focus should be on targeted campaigns that ensure profitability on each order, considering the unique value and margin of each product.
When most media spend is geared toward acquiring new customers the relationship between ad spend and first-order profitability becomes critical for any ecommerce business.
If the new customer contribution is either zero or negative, and assuming there's no cost of customer acquisition (CAC), the revenue generated from existing customers, after subtracting all delivery costs, must exceed operational expenses (OPEX).
In other words, your business must be profitable every month based on your existing customer revenue alone to make sacrificing first-order profitability even remotely viable.
Brands often overlook the critical relationship between their existing customer revenue and OPEX.
If you want to build an ecommerce business, it's vital to scale your OPEX in line with your existing customer revenue.
Ideally, all your first-order contribution should translate into profit. But in many cases, first-order contribution is negative, deteriorating existing customer contribution margin.
Then, you have virtually no chance at profitability.
Brands need to understand how their OPEX correlates with revenue. Achieving positive first-order revenue is essential to cover OPEX costs.
If your aim is aggressive growth with a strong Lifetime Value (LTV), consider operating with lean OPEX so that your existing customer contribution surpasses your OPEX. This strategy ensures profitability, even if you're just breaking even on the first order.
Achieving this balance can be challenging, especially if your first-order profit negatively affects your contribution margin. However, understanding first-order profitability, how to define it, how to generate it, and how to structurally set it up, all relates to our ability to generate a P&L outcome.
Know your OPEX, recognize your company's fixed expense obligations, and understand the modeled existing customer expectation.
These insights will guide you in setting acquisition targets that yield sufficient first-order contribution for profitability.
Some argue the importance of LTV, suggesting that a loss on first-order could yield a greater return on invested capital.
That’s a belief I held for a long time. It's the model a lot of the historical ecommerce businesses were based on. I've trumpeted LTV to CAC. It's still an important metric to consider and there are gold standards for it.
However, it's very rarely the case that your efficiency curve and the amount of volume of revenue that you can generate in the future warrants sacrificing short-term profitability.
Lifetime Value (LTV) can become a double-edged sword when thrown into a first-order profitability consideration. While it's a valuable metric, relying solely on LTV can lead to risky decisions, especially if it means sacrificing short-term profitability.
To balance the pursuit of lifetime profit with the realities of current cash flow and risk, we have developed custom Spend and aMER models here at Common Thread Collective.
These models help us understand the relationship between spend and efficiency in any given period of time for a specific business.
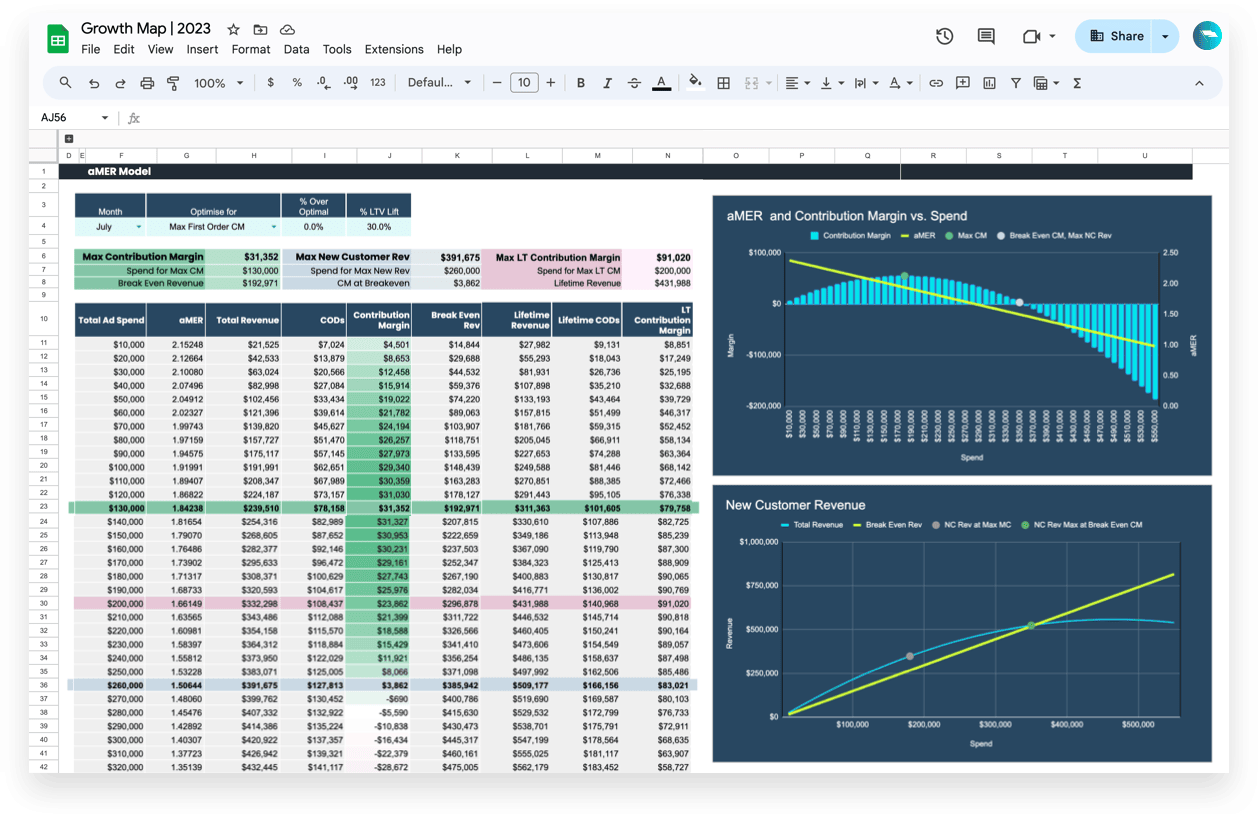
We do this by running a regression of all of their historical relationship between spending and efficiency, in different periods of time to understand the rate at which efficiency will degrade as you increase spend. From there, we can define the optimal budget for your business in any given month.
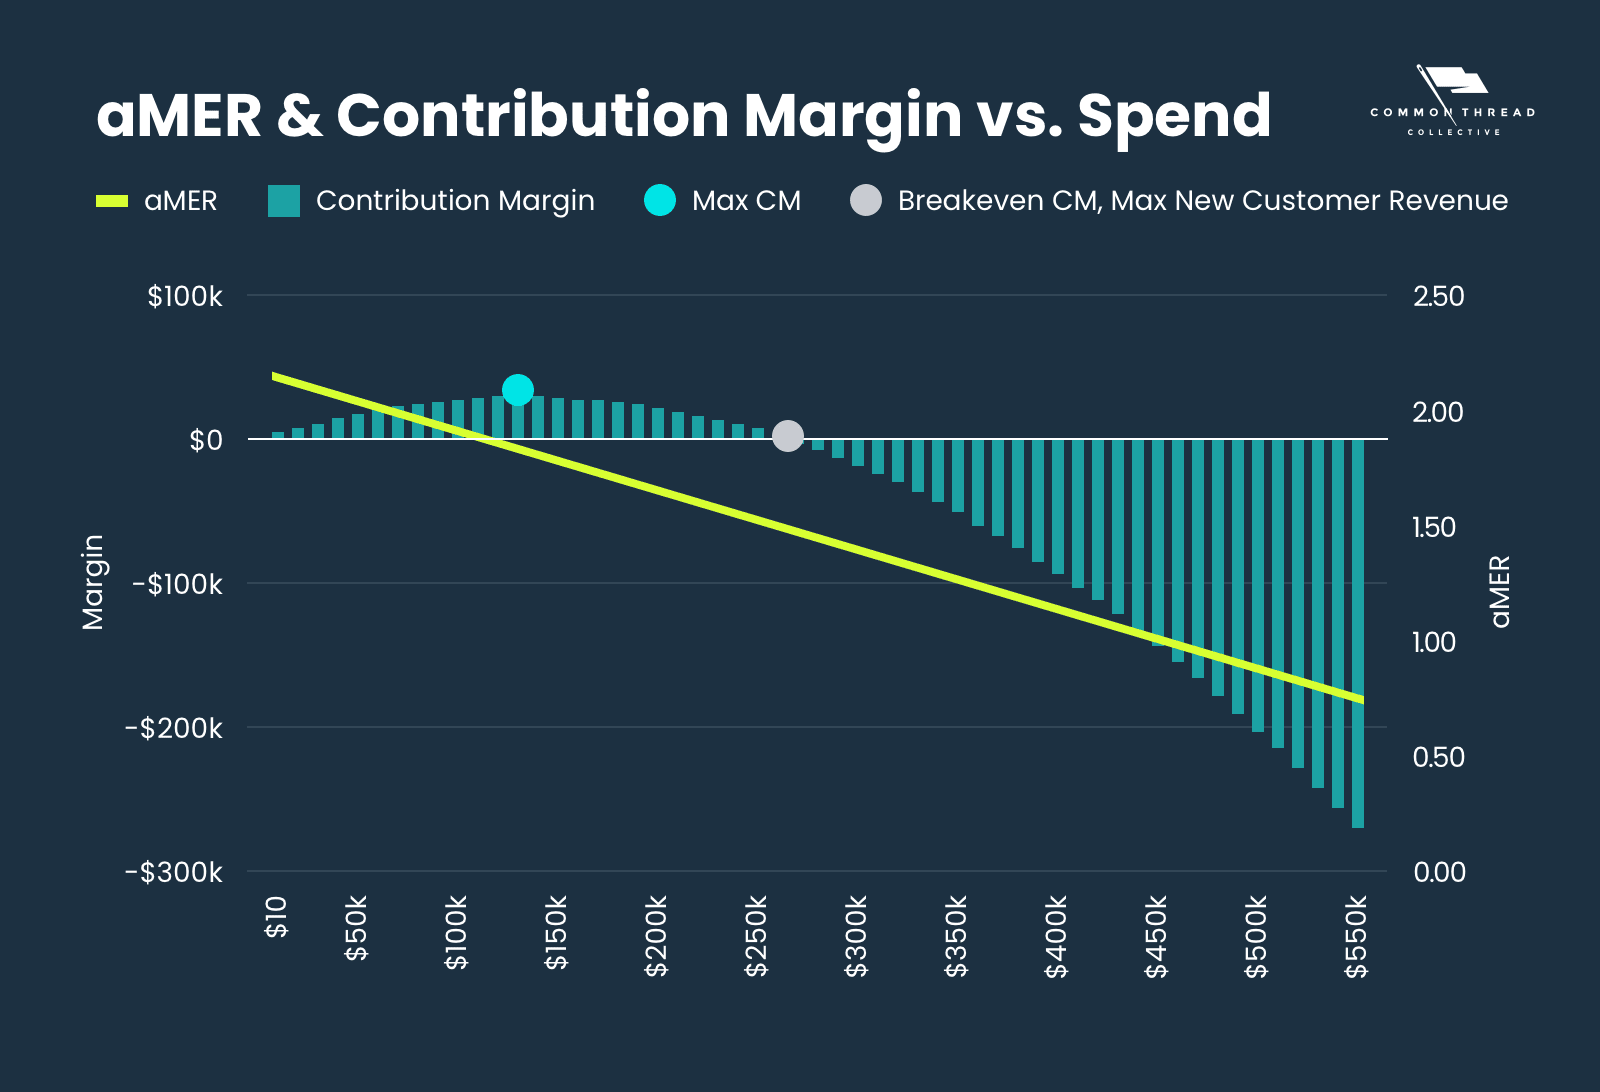
In the process of building these models, we identify the recommended budget threshold to maximize first-order contribution, which is denoted by the green line here.
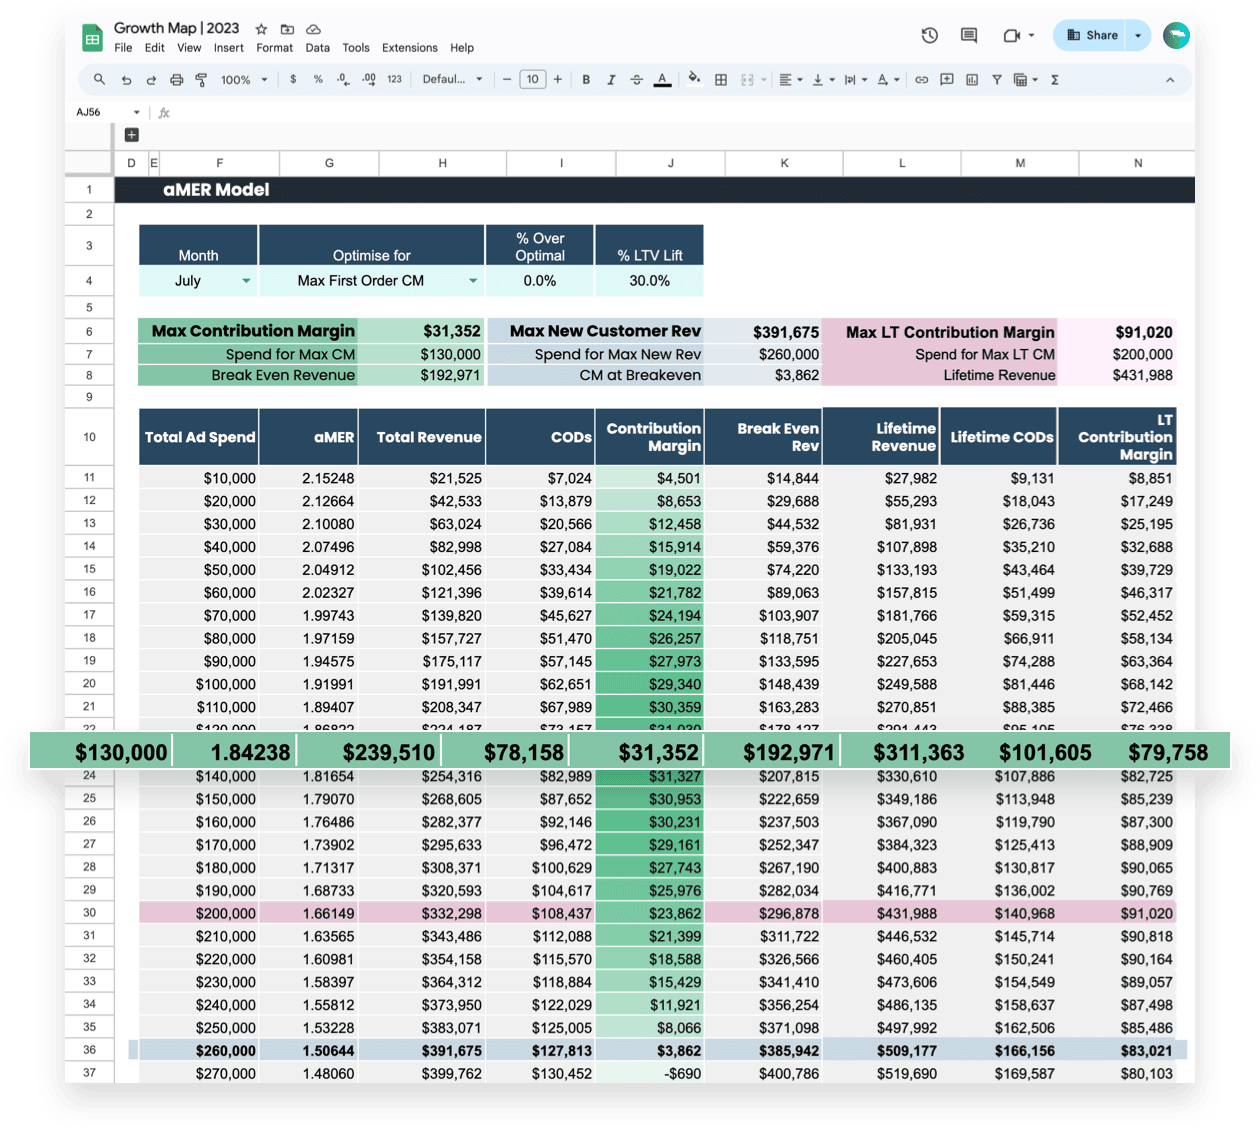
In the above example, $130,000 at a 1.8 generates $240,000 based on the cost of delivery for this business. That's the maximum outcome.
That's the point at which on this curve, we're maximizing first-order profit.
But what about lifetime profit?
Many businesses will want to maximize for lifetime profit, not just first-order profitability.
The difference when maximizing lifetime profit is small, and the risk increases exponentially.
In this case, we're going to use our brand, Bambu Earth, and we're going to start modestly with a 60-day LTV, which for us is about a 30% increase.
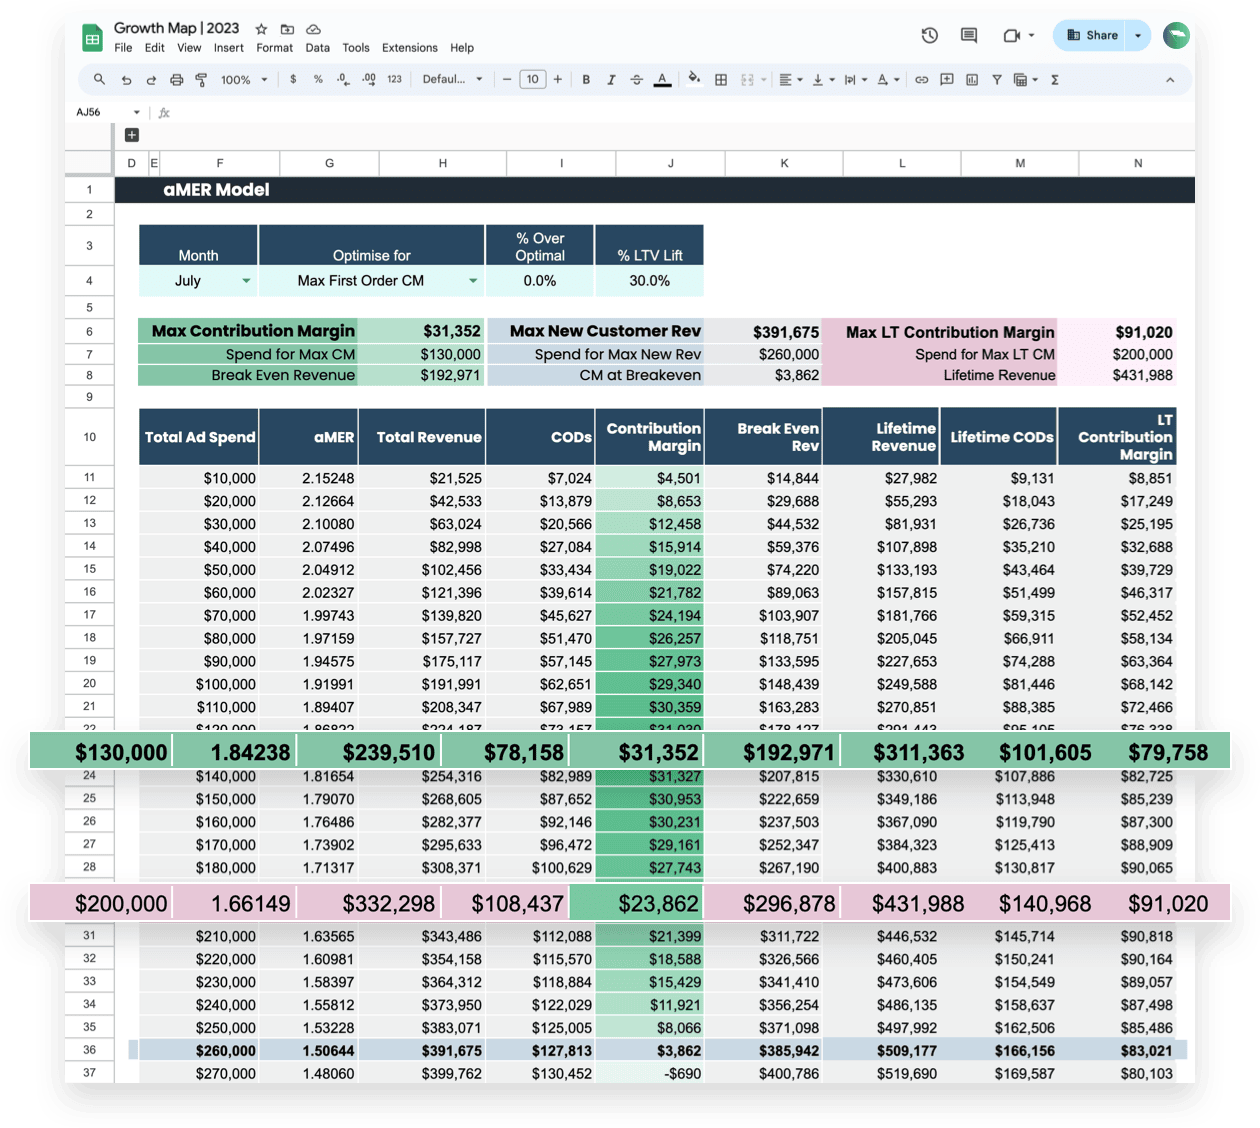
Our modeling shows to maximize lifetime profit, I should spend an incremental $70,000 — spend $200,000 at a 1.66 to generate $330,000 in new customer revenue. So a hundred thousand more dollars.
But in the first month, we make $8,000 less on that much more spend. And throughout the lifetime, 60-days, I'll make an incremental $12,000.
Is risking $70,000 to generate an incremental $12,000 worth it?
With enough existing customer revenue, there might be an argument for that. But here's the problem, there's no risk adjustment to this future value.
There’s the risk that cohorts tend to degrade in value as you go up and further out the customer curve. So there's a chance that the LTV could be wrong.
There's also a chance that as I spend more money, initial CAC degrades faster and is worse than anticipated. What if I accidentally spend on those customers again in my acquisition funnel?
There's no consideration for the cost of capital. There could be issues with the product, the return rate could be higher, or margin profile could be off, etc. All these factors that are calculated into our model, add additional risk to the future revenue.
Is the sacrifice of $70,000 against a risk-adjusted value of $12,000 worth it?
For almost every brand, in almost every cash position, in this moment, the answer is no.
This scenario changes if you have a brand with an extraordinary lifetime contribution, closer to 300% LTV.
Maximizing against a 300% LTV would still deteriorate cash in the first month. Any brand trying this better have the financial wherewithal to be able to float that kind of latent value capture.
Every month leading up to your 300% return, you’re still going to generate negative cash on your P&L every single month from new customers.
It will take a while for existing customers to offset that — this is a bet on a very long-term future value capture.
Without such an extraordinary lifetime contribution, there’s almost no scenario where the lifetime value increase outweighs the incremental risk of losing money in the short term, depleting cash, and creating overall cash risk in the business.
First-order profit, in almost every scenario — with the only exception being extreme outliers of LTV — should be the governing policy.
One of the reasons we are such huge proponents of cost controls when it comes to media buying is:
Every campaign in CTC context has a specific offer, audience, and angle. Each individual ad concept has a projected AOV, a margin for that value tells you what the break-even CPA, where to set cost caps, and the minimum budget needed to generate 50 purchases per week.
Each campaign must consider the unique order value, the unique margin, and the expected maximum CAC that you're willing to pay. When you institute this level of specificity, it ensures that the dollars are only being spent if they generate incremental contribution.
This is the key of this whole thing.
Dollars are not worth being spent to generate a false top-line revenue, while deteriorating the amount of money in your bank account.
Its better to spend no dollars at all and to capture only the organic demand that exists.
You will have a healthier business than if you were to spend money at a negative first contribution.
If you spend a dollar and you trade 1 for less than 1, that top-line revenue has not helped you. It didn't grow your business. You haven't succeeded. You have only deteriorated the amount of money in your bank account.
Cost controls with specificity of order value, specificity of margin, defining what you're selling at what value, inclusive of all the variable expenses, and reconciling those constantly is the pathway to the disciplined acquisition that necessary to make your business grow predictably and profitably.
Understanding and implementing first-order profitability is crucial for the health and growth of any ecommnerce business.
If your business has been spending at a net-negative new customer acquisition, its not too late to course-correct. We encourage you to reevaluate your strategies and consider these principles in your marketing operations.
We help businesses reduce spend, and create this obligation to efficiency all the time.
Grow the overall margin of your business, not a false top-line revenue number.
Predictable, profitable growth might require a reset of top-line growth expectations for your ecommerce business. But fake revenue revenue propped up by non-profitable new customer contribution is not worth keeping around.
Eliminating it will create a much healthier scenario for your business.
This is just one example of the many brands that we have helped to reset.
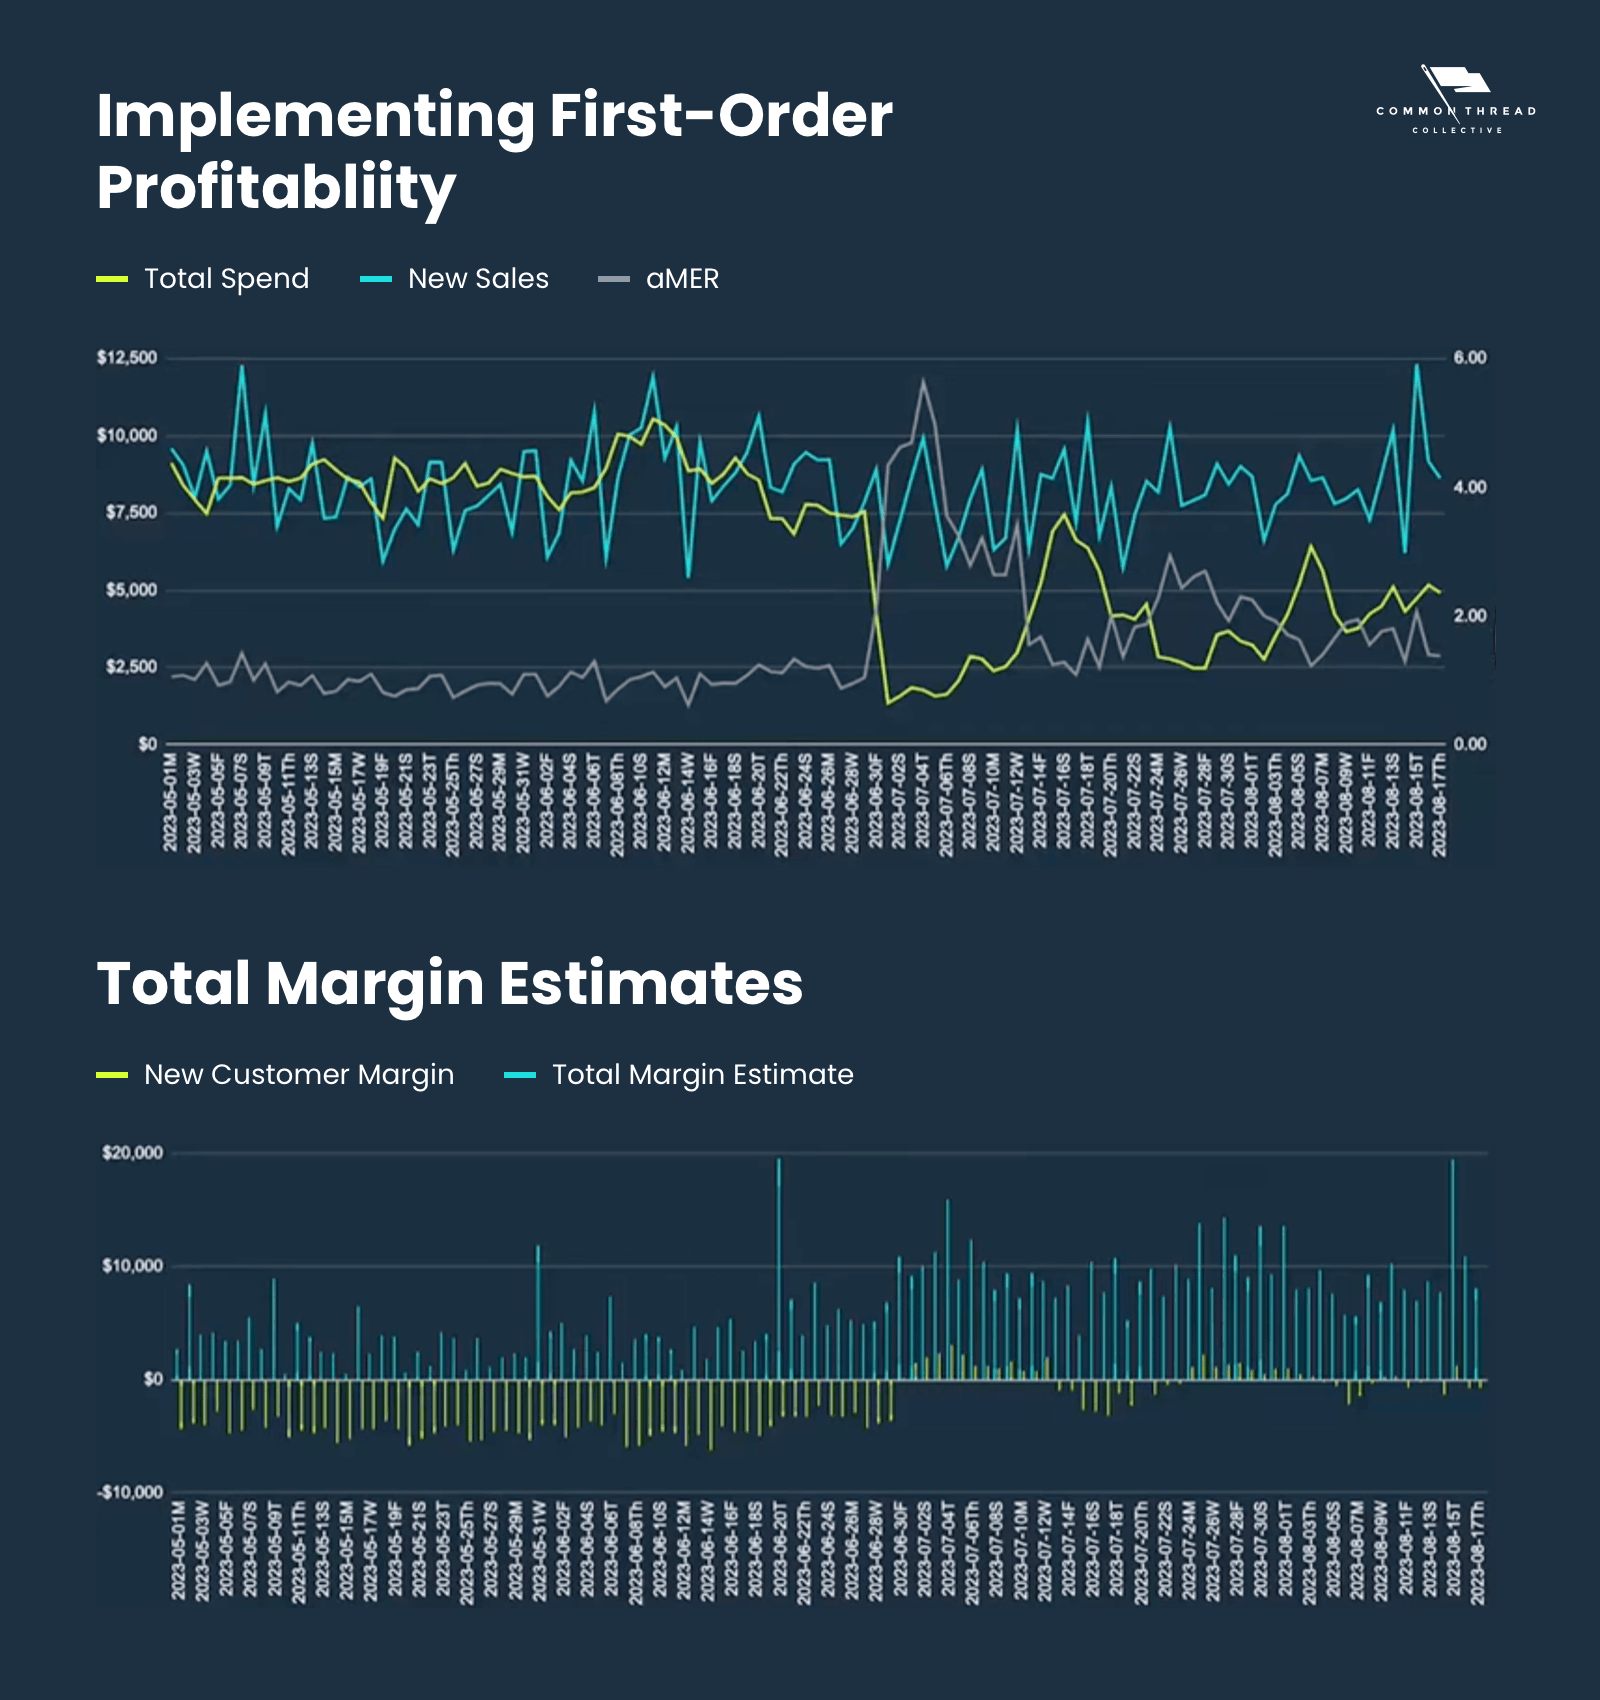
When this client came to Common Thread Collective, they had fairly constant new sales, spend, and efficiency. But with an acquisition efficiency (aMER) below 1 … they were spending more money to acquire new sales, than the amount of money those sales generated.
The sudden, stark decline in total spend alongside an inversely steep increase in efficiency on this graph represents our intervention into the account.
This shift happened when creating an obligation for first-order profitability.
Before implementing a system focused around first-order profitability, new customer acquisition was constantly negative — eating into the overall margin of the business.
Clarity around what happens on first-order is vital.
Check those Meta campaign structures, and stop spending too much on other channels at the cost of overall profitability.
Responsible acquisition, a reduction in overall spend, doesn’t always mean a sacrifice to overall revenue … as in the example above. But it will ensure you grow the overall margin of your business.
We're going to get rich.
Our 'Bridges' series explores various aspects of financial planning in marketing and aims bridge the gaps between marketing and finance.
It's going to be meaty, and data-driven, and help marketers understand the financial impact that they're making on the organizations they serve so that they can increase their authority in the organization.
As always, if you need help with this, it's what we're here to do at CTC, whether it's on a consultative basis, a tools and system basis, or as actually managing and handling your ecomm.

We’ll work with you to custom-build CTC’s predictable, profitable growth system for your ecommerce business.
Get Started