Exclusive Access to the DTC Metrics that Matter Most
27 Key Metrics, Updated Weekly
From store CAC to Facebook ROAS, the DTC Index contains charts tracking year-over-year data points from all parts of the funnel.
Subscribe Now

by Steven Rekuc
Aug. 09 2023
That’s the question that burns in every forecaster and marketer’s heart, because Customer Acquisition Cost (CAC) impacts everything.
If only CAC fluctuations weren’t so difficult to predict.
The number of variables that affect CAC, and the interactions between those variables, lead many marketers to simply throw in the towel and guess.
But if you’re wrong, and next month’s CAC is wildly off from your predictions, you’re looking at potentially devastating misses.
Guessing won’t get you there. So we set out to find a better way to answer that big, burning question.
And it starts with another question:
What factors cause CAC to rise and fall?
To jump directly to the results of our CAC test, click here.
Most experienced marketers know intuitively that CAC rises with an increase in spend and vice versa, but is that really true?
Turns out, the answer is a clear “yes.”
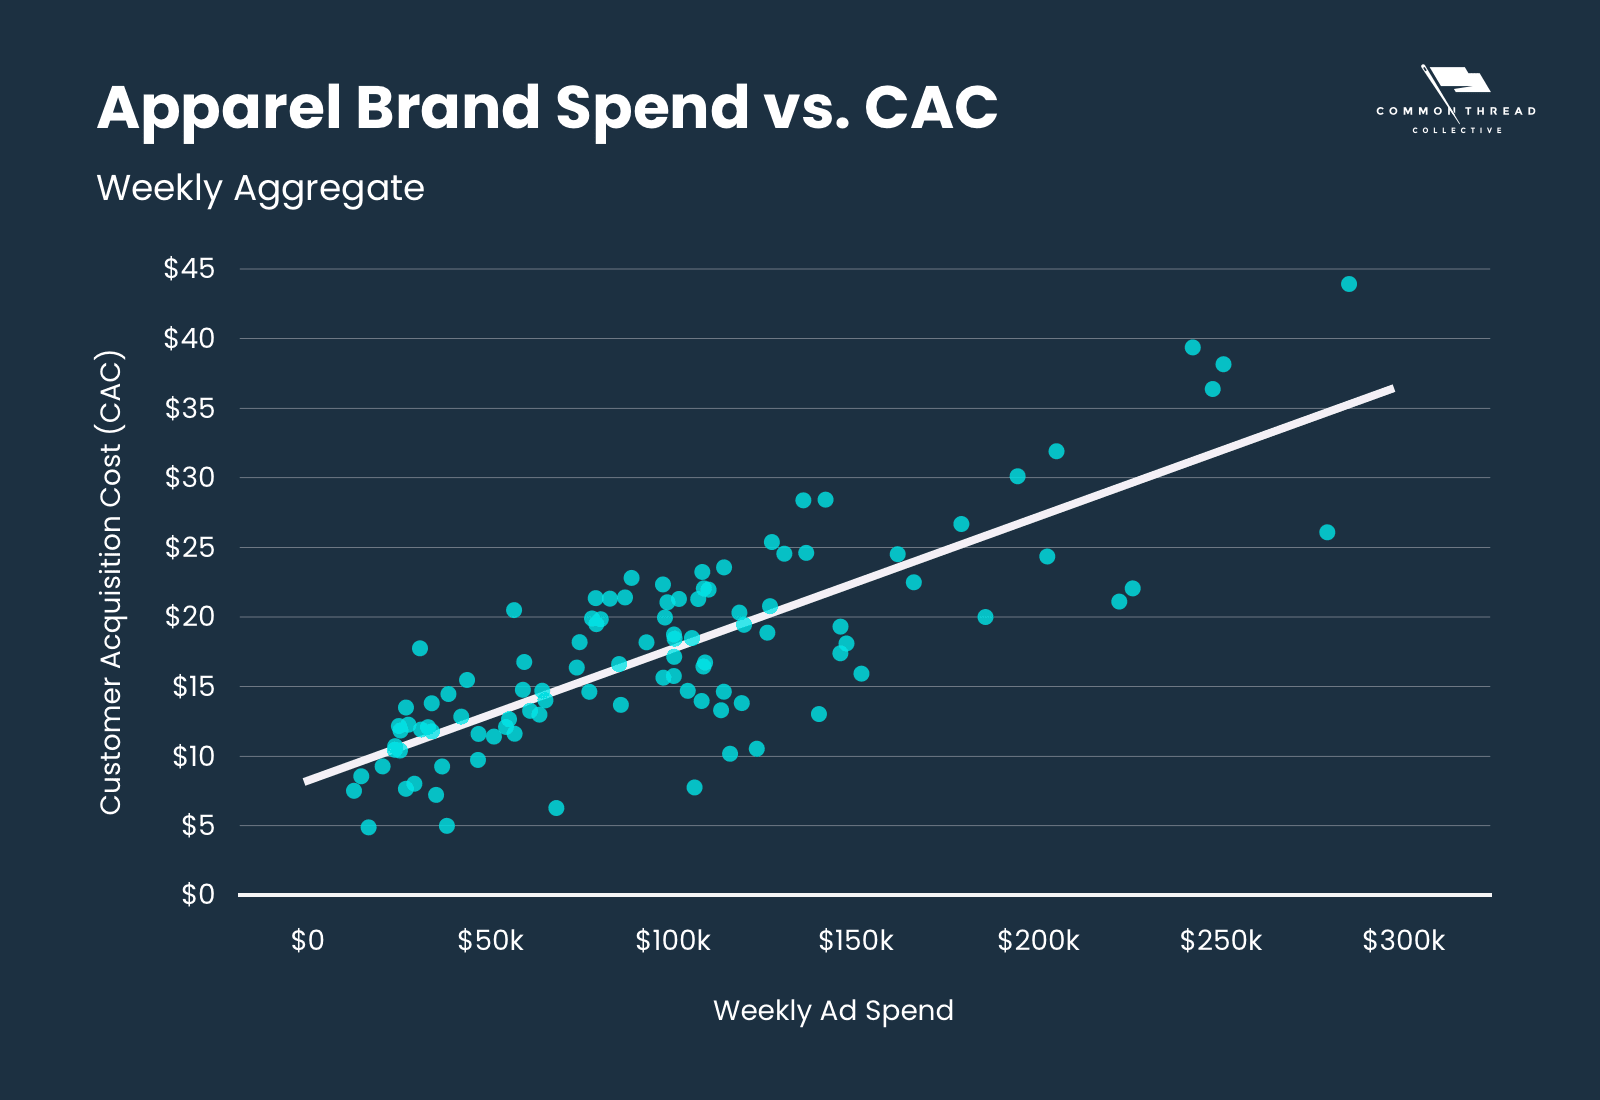
Our models found a reliable linear relationship between Total Ad Spend and Weighted CAC without accounting for other variables.
This is a good starting point for CAC modeling.
For this particular brand, every $10.5k of Spend increase correlates to a $1 rise in CAC.
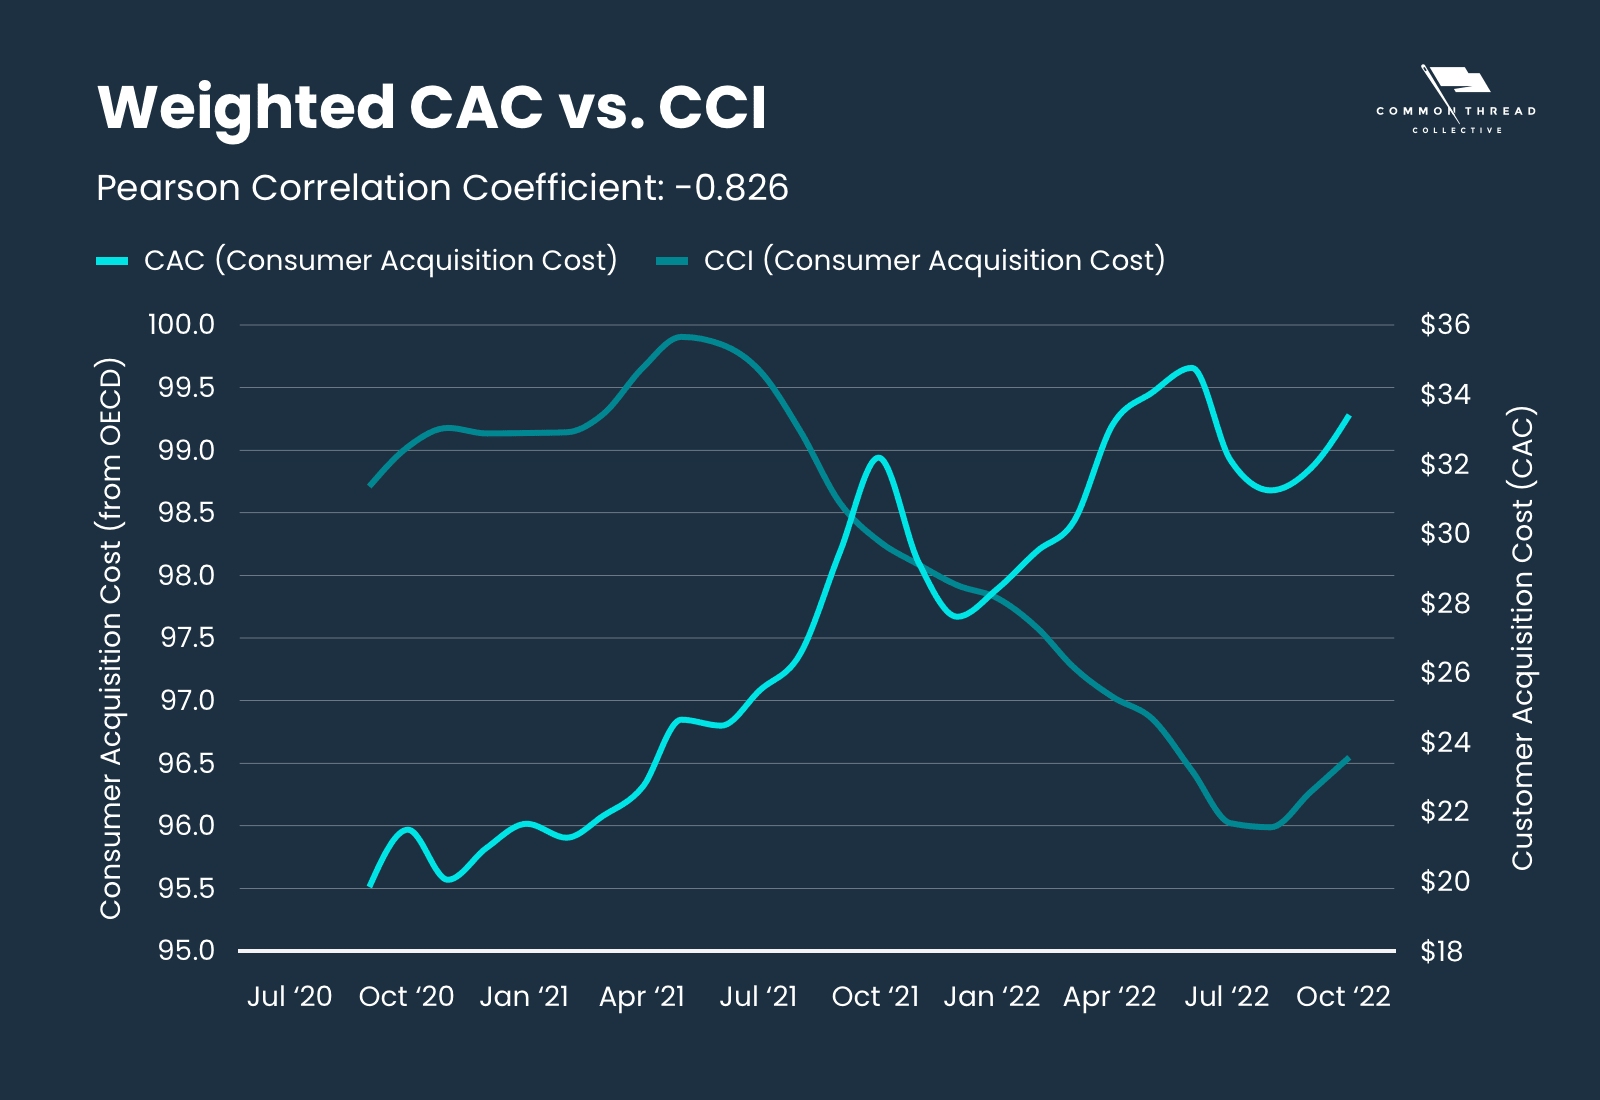
Most ecommerce data analysts have an enormous blind spot: the impact of macroeconomic signals on individual brand performance.
In the process of putting together a CAC modeling package for Dan Frommer of the New Consumer, we noticed something fascinating:
Customer Acquisition Cost was going up as the Consumer Confidence Index (a monthly survey of public sentiment vis a vis the state of the economy) decreased.
This makes sense: less confident consumers take more convincing, and that costs money.
While individual ad performance changes in the long run it’s rare for the CAC associated with that ad to fluctuate wildly month-over-month:
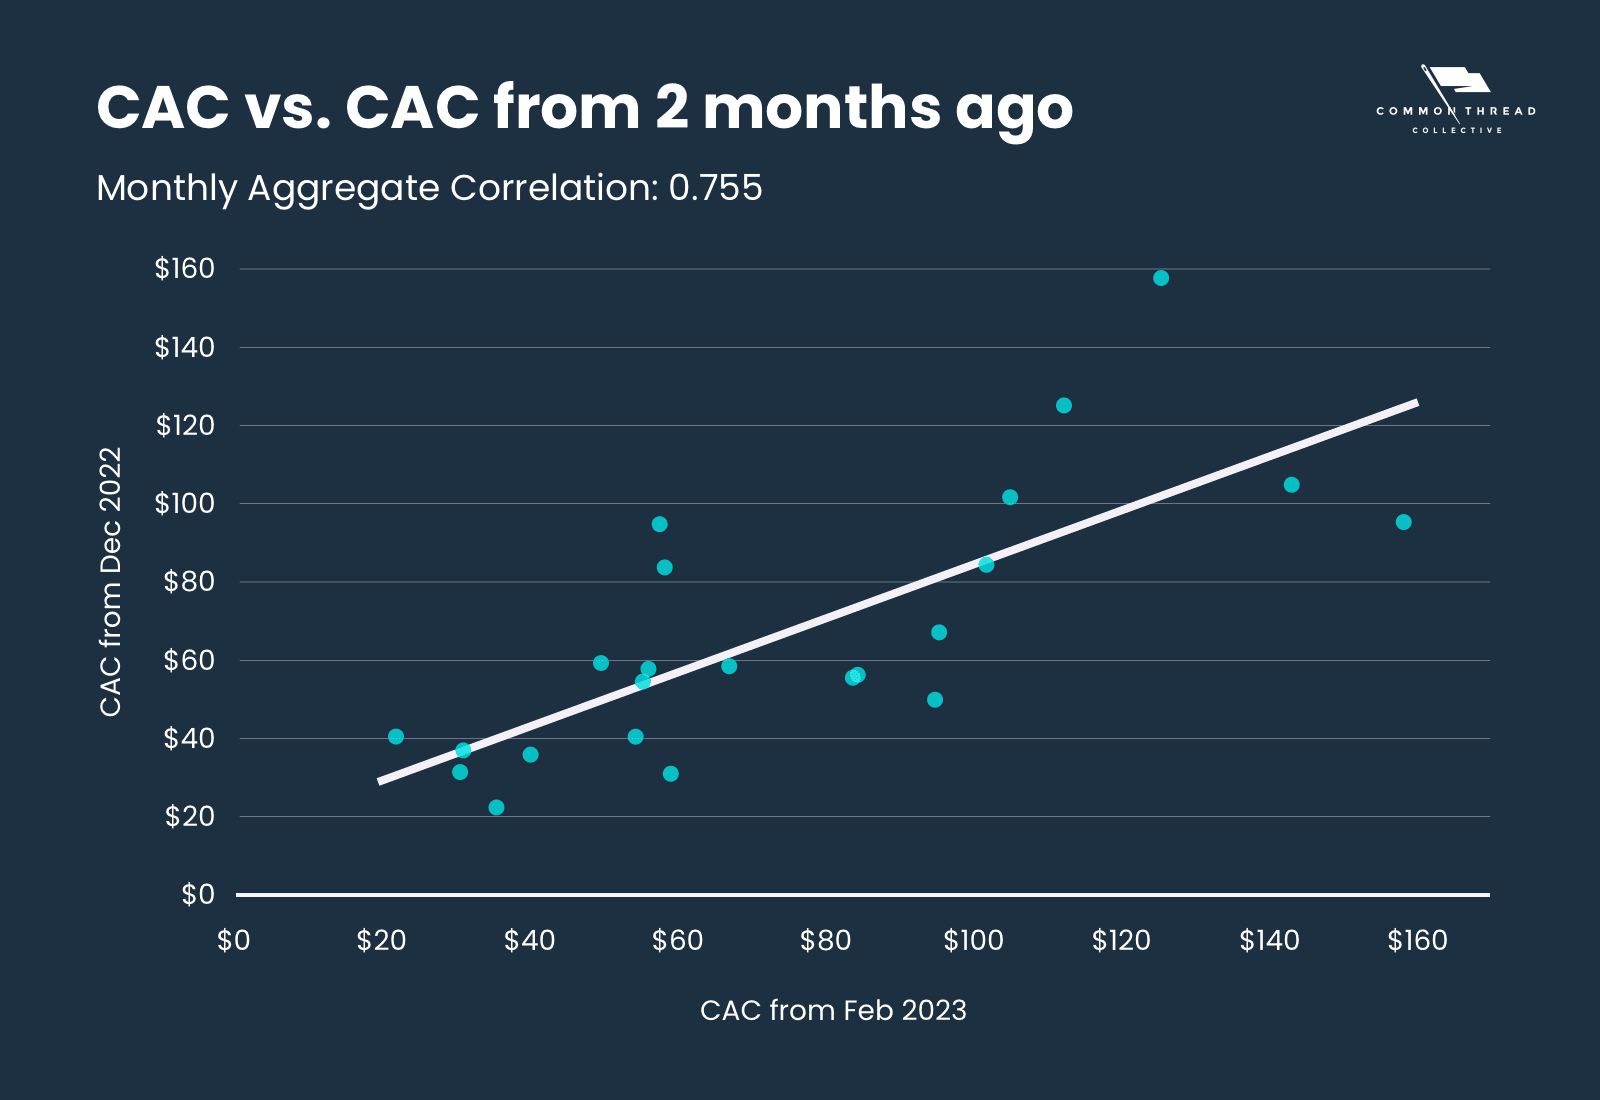
Again, there’s an intuitive sense here: most brands don’t delete all of their ads and cancel all of their campaigns at the start of a new month, so the aggregate performance of an ad account will look pretty much the same on February 1st as it did on January 31st.
The 3 factors above, plus an additional variable to account for seasonality (CAC drops in November and December in aggregate) give us a solid basis for CAC prediction.
We used that resulting model to predict CAC for November of 2022 and put it up on Twitter to hold us accountable to that prediction:
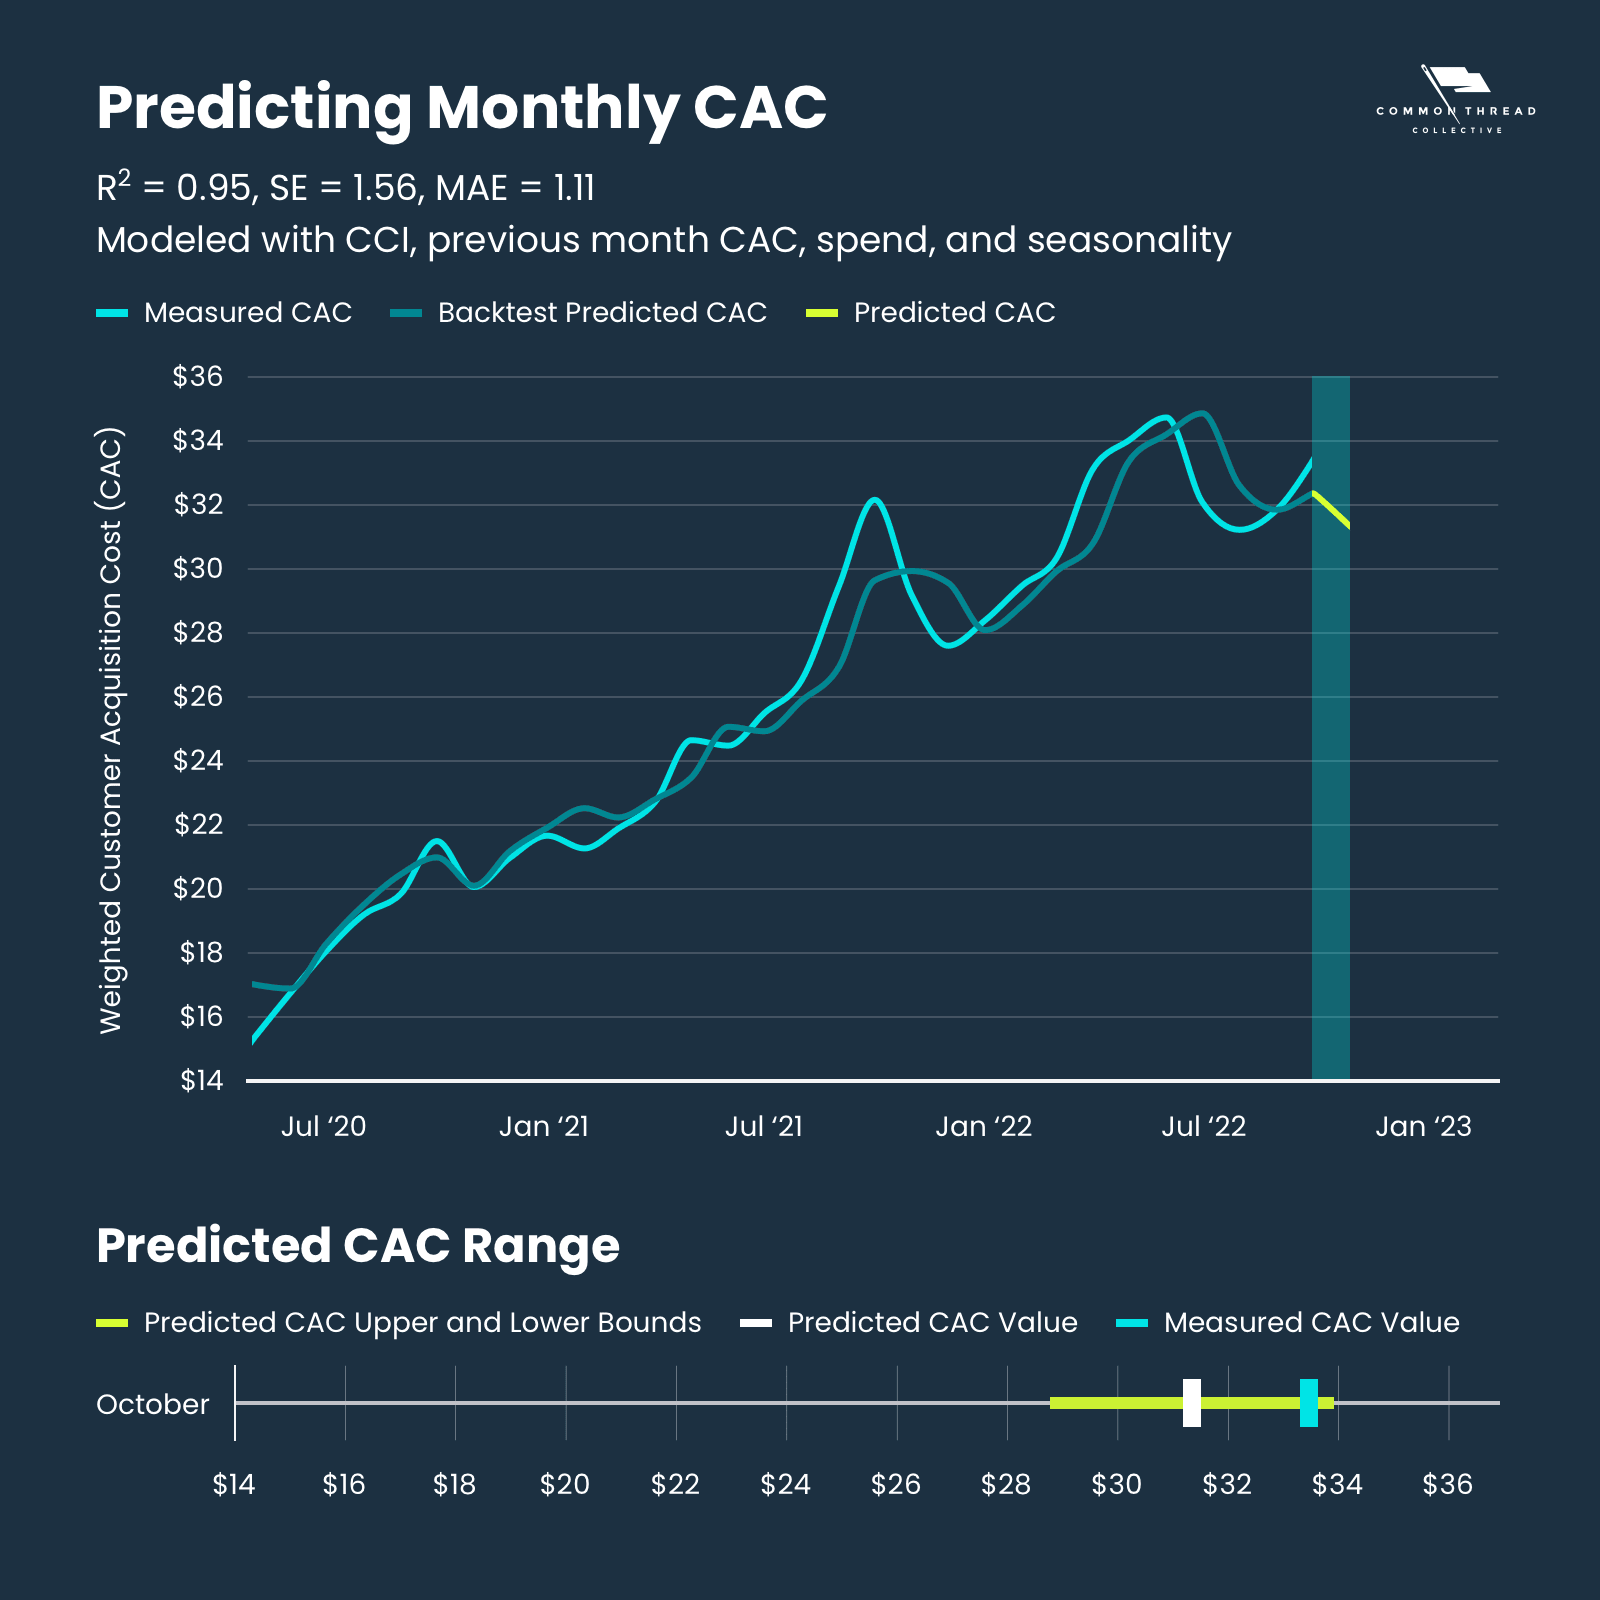
Well, we were 6.3% off, but it was a good learning experience. We said $31.34 for the monthly CAC and it came in at $33.46. That was still within the 90% confidence interval of $28.77 to $33.91.
But predicting aggregate CAC on its own is simply a cool trick … unless you can reliably predict CAC for your brand.
Turns out, what works in the aggregate also works on an individual level … with some notable caveats.
To illustrate: At the end of last year, we modeled December CAC for a single brand using the information that was available to us in November — October CAC, October CCI, forecasted Spend, and an adjustment for seasonality.
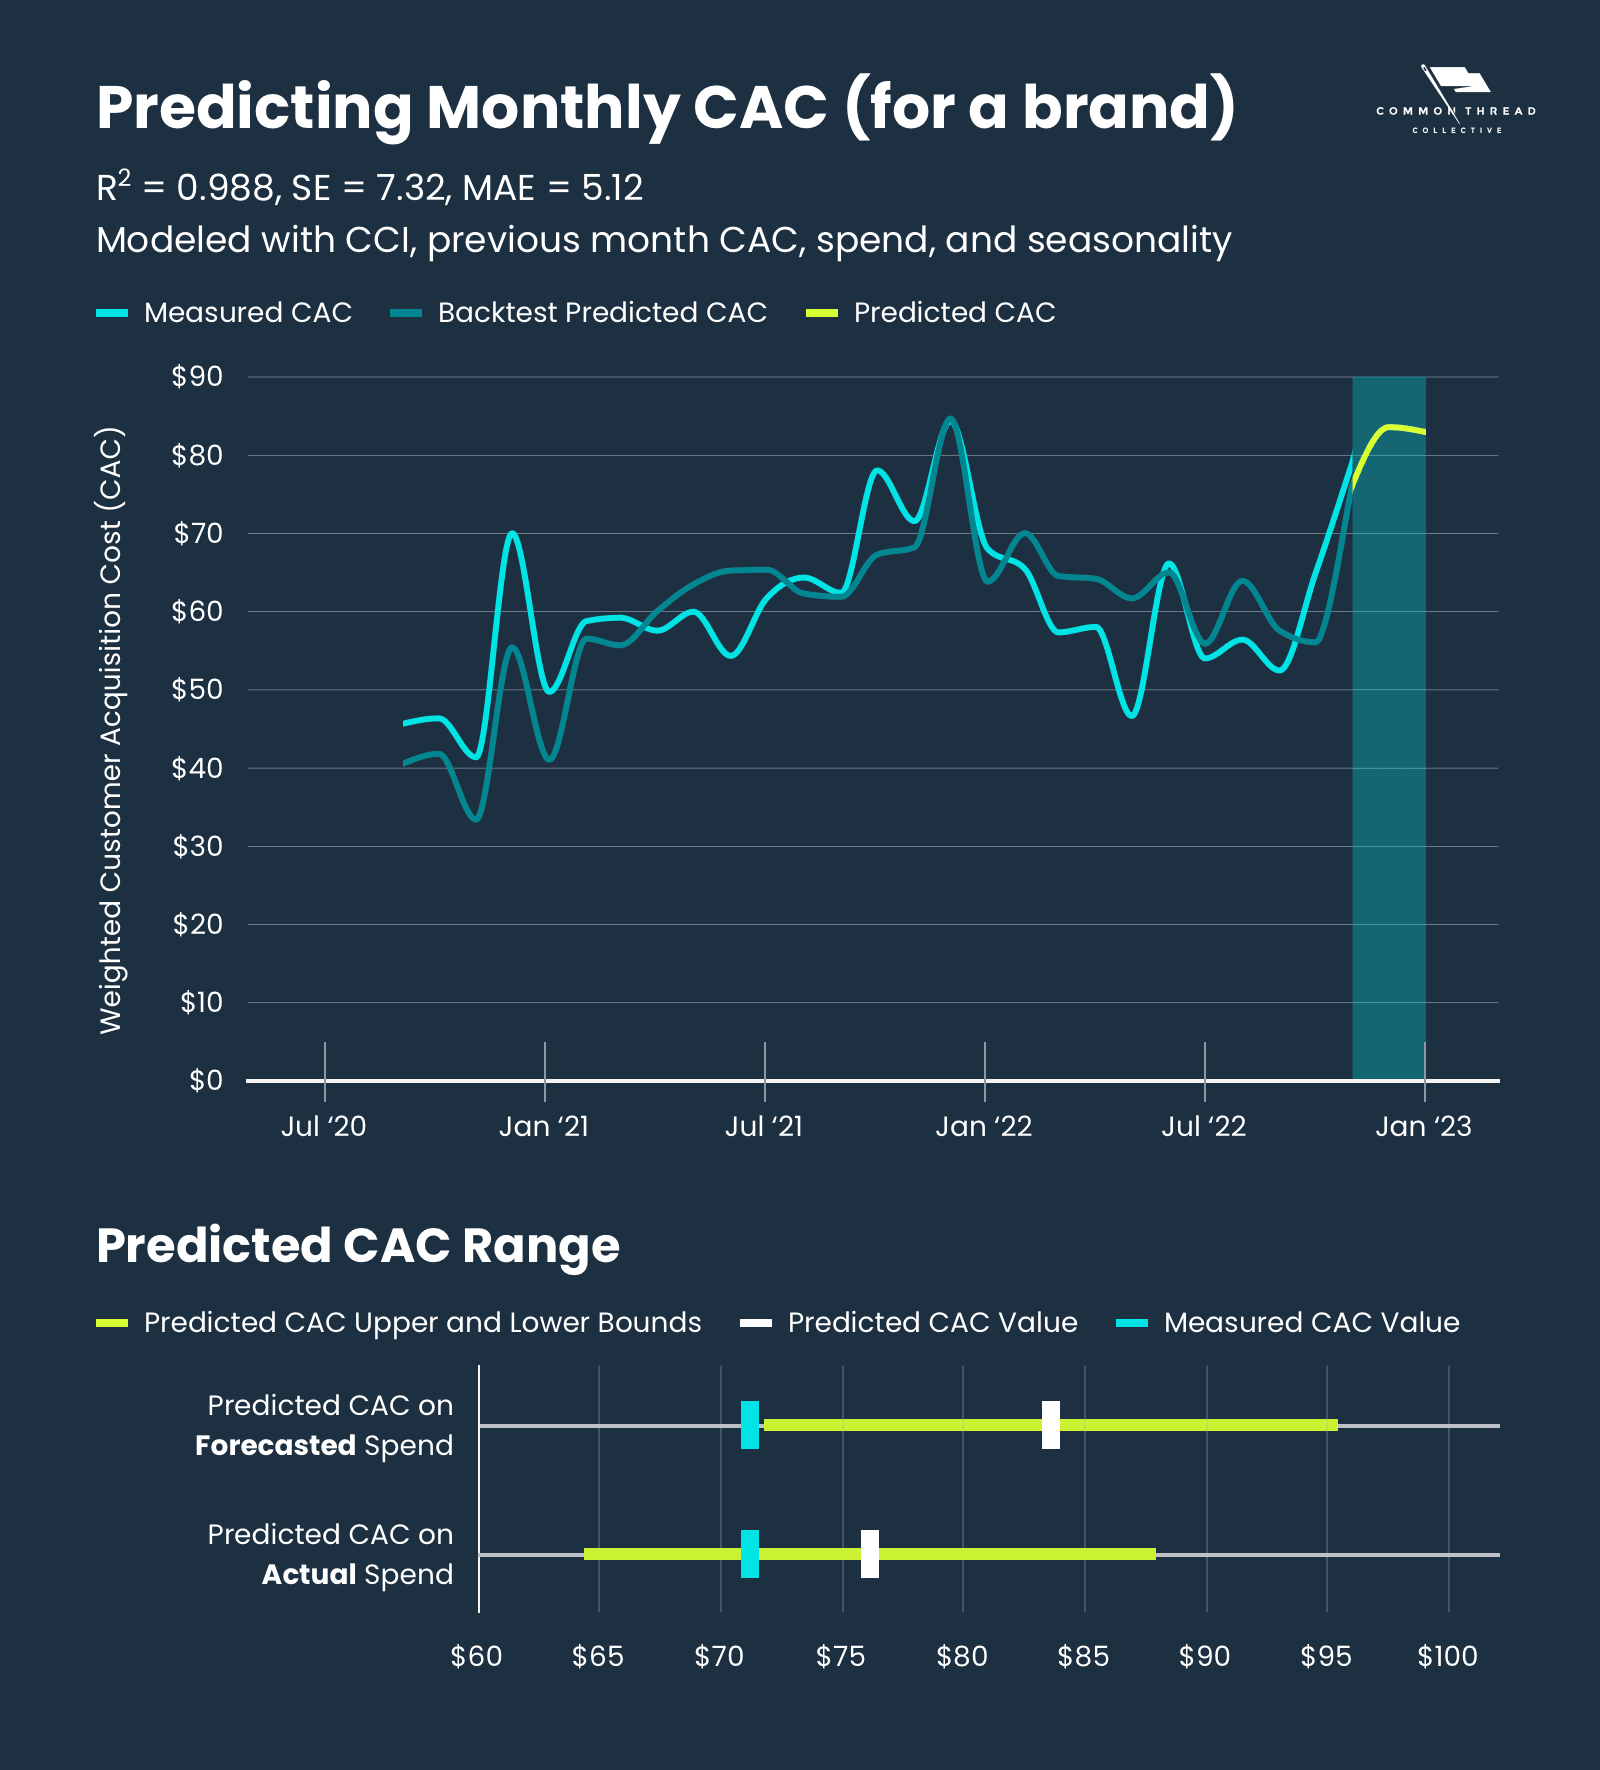
Unlike the aggregate model, however, the results were not as accurate as we had hoped …
We predicted CAC to be $83.54 and it came in at $71.15.
We were off by 17% and outside of the 90% confidence interval.
It turns out, however, that the reason was fairly straightforward: Ad spend for that month was 20% under target — a huge miss.
If we’d used this figure in our model instead, our prediction would have been $76.09 - much closer to the actual value of $71.15 and within the confidence interval.
While predicting next month’s CAC has its uses, meaningful predictions have to extend further than that.
To do so, consumer confidence and last month’s CAC are no longer relevant variables.
Instead, we’ll need to use historical data to predict seasonal fluctuations.
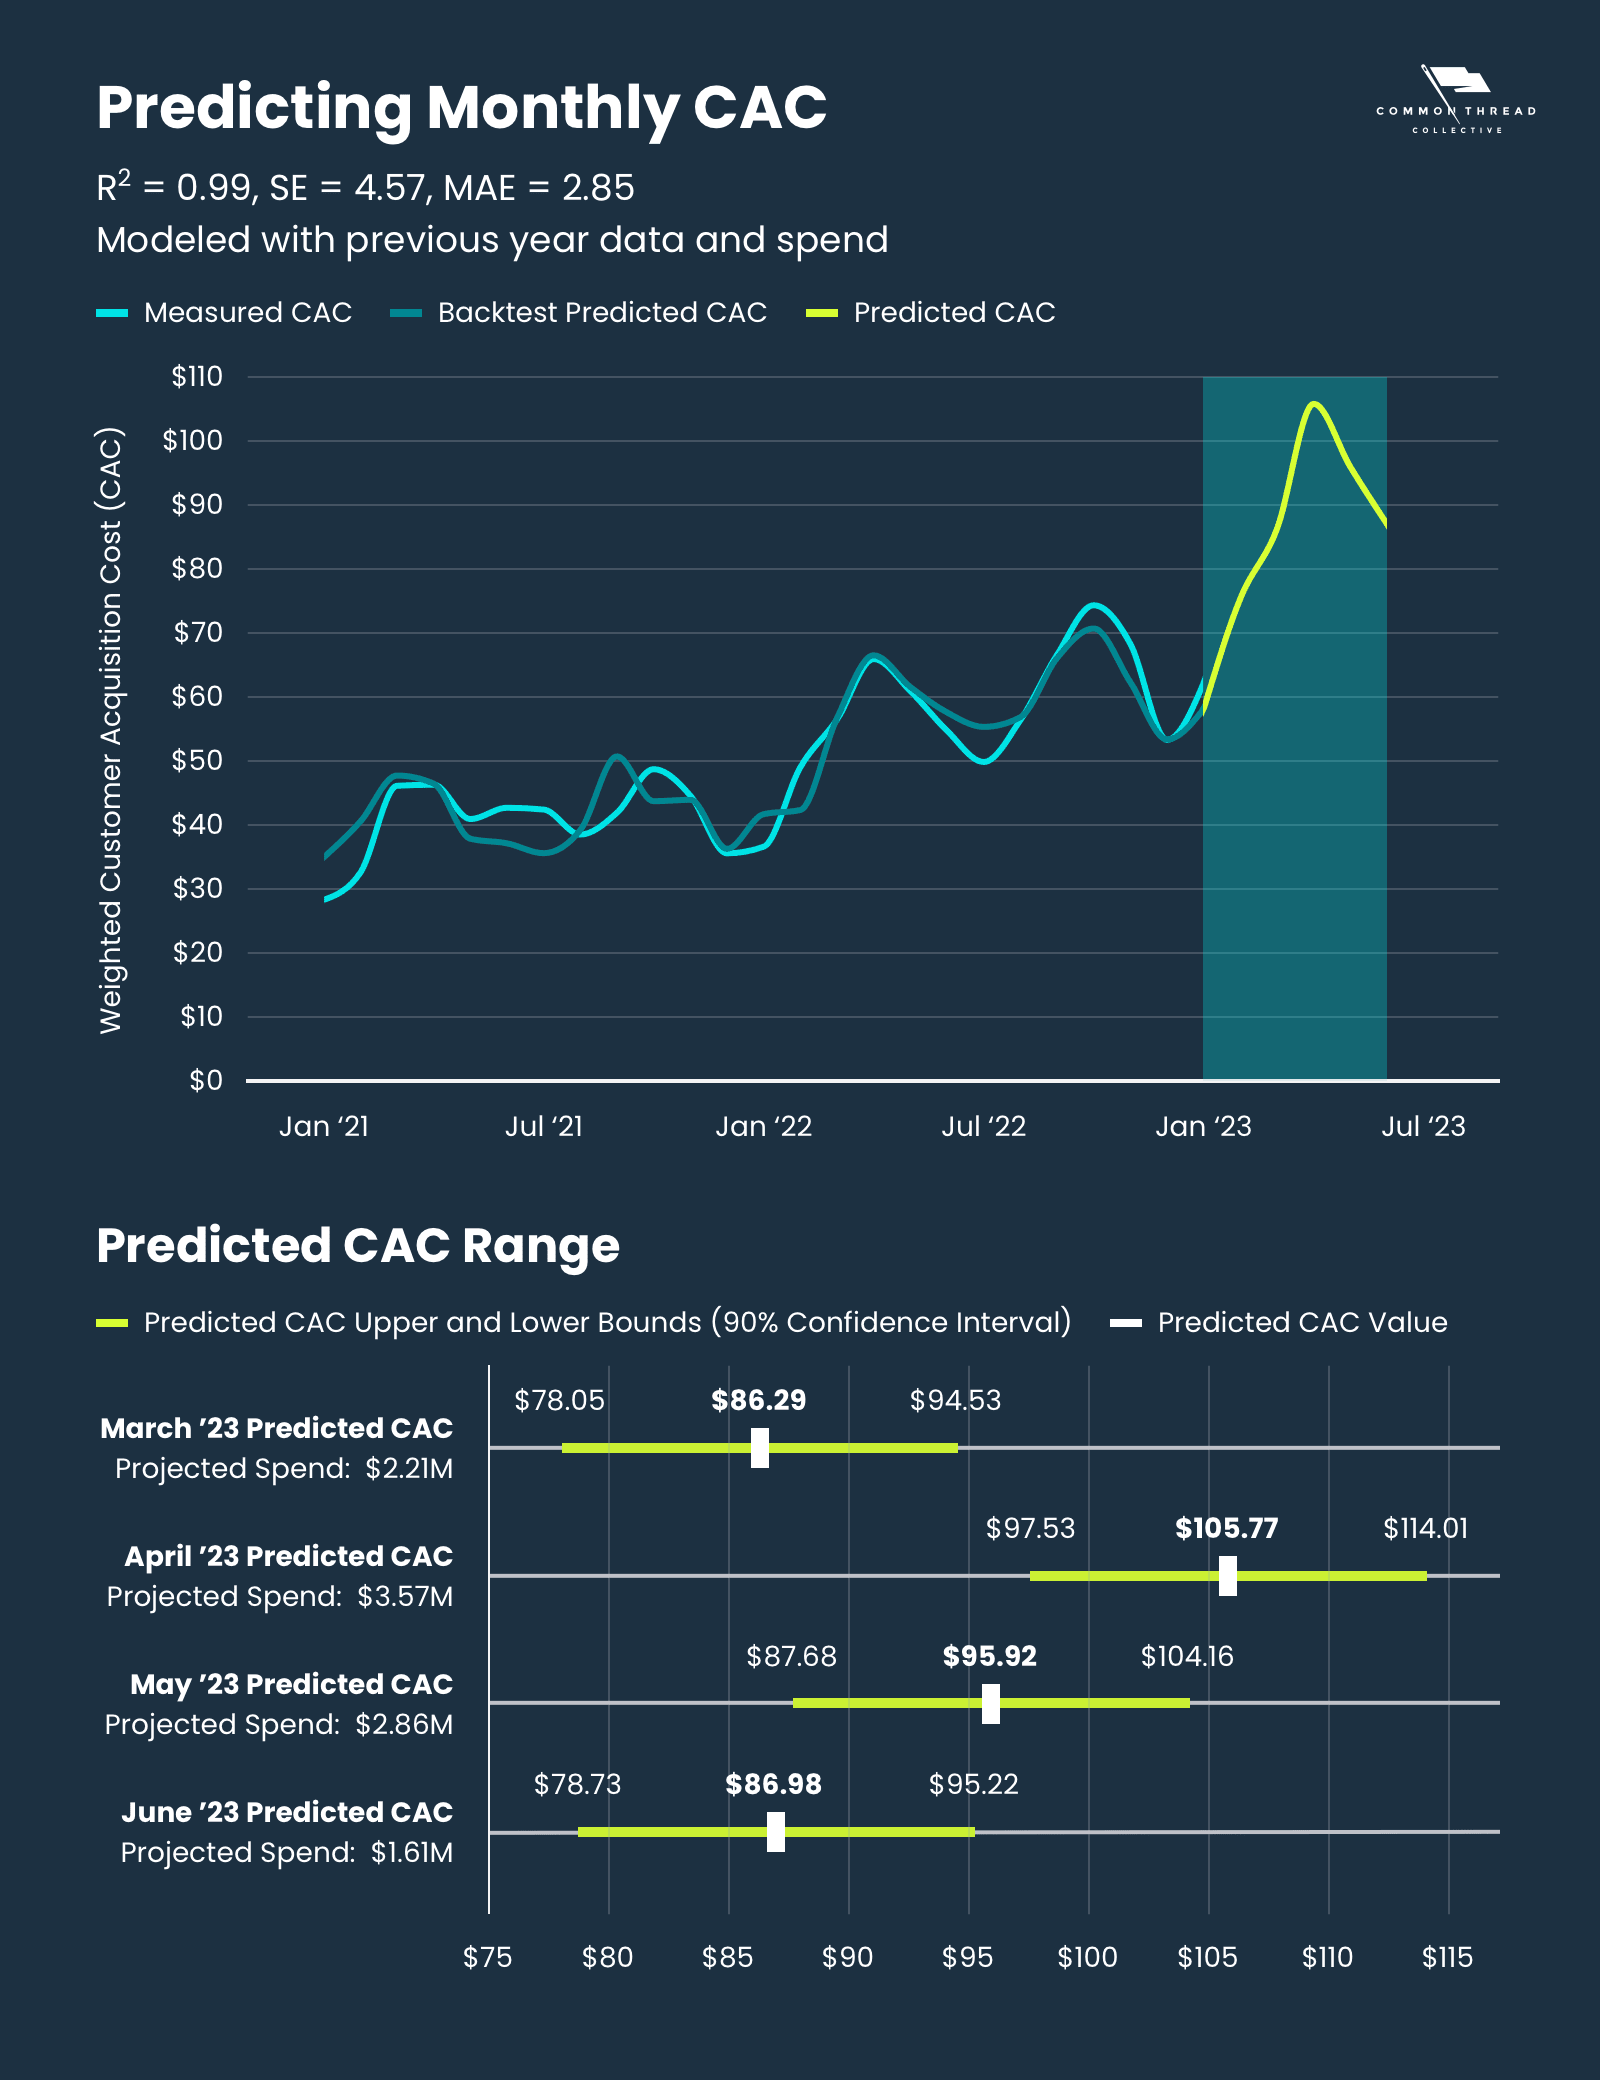
We produced this model for a Home Goods brand using data from both Statlas.io (and reported in our DTC Index) and historical data from the brand to make predictions for March, April, May, and June of 2023.
In other words, we’re going out on a four-month limb, putting our model to the test in full view of the public.
So, how did we do?
Turns out, the CAC we predicted when we first published this piece was significantly higher than what actually happened.
Our modeling came up short for a few reasons:
The model we built was based on using budgets from the same months last year, but our actual spend was significantly lower. As we pointed out above, CAC typically increases with an increase in spending. So, the lower amount of spend yielded a lower CAC:
Predicted Spend: $2.21 Million
Actual Spend: $1.48 Million (-33% less than we used in our model)
Predicted CAC: $86.29 (32.33% above the measured value)
Measured CAC: $65.21 (24% less than we predicted)
Predicted Spend: $3.57 Million
Actual Spend: $2.21 Million (-38.04% less than used in our model)
Predicted CAC: $105.77 (64.91% above the measured value)
Measured CAC: $64.14 (-39.36% less than we predicted)
Predicted Spend: $2.86 Million
Actual Spend: $2.32 Million (-18.94% less than used in our model)
Predicted CAC: $95.92 (41.06% above the measured value)
Measured CAC: $68.00 (-29.11% less than we predicted)
Predicted Spend: $1.61 Million
Actual Spend: $1.22 Million (-24.04% less than used in our model)
Predicted CAC: $86.98 (21.08% above the measured value)
Measured CAC: $64.10 (-17.90% less than predicted)
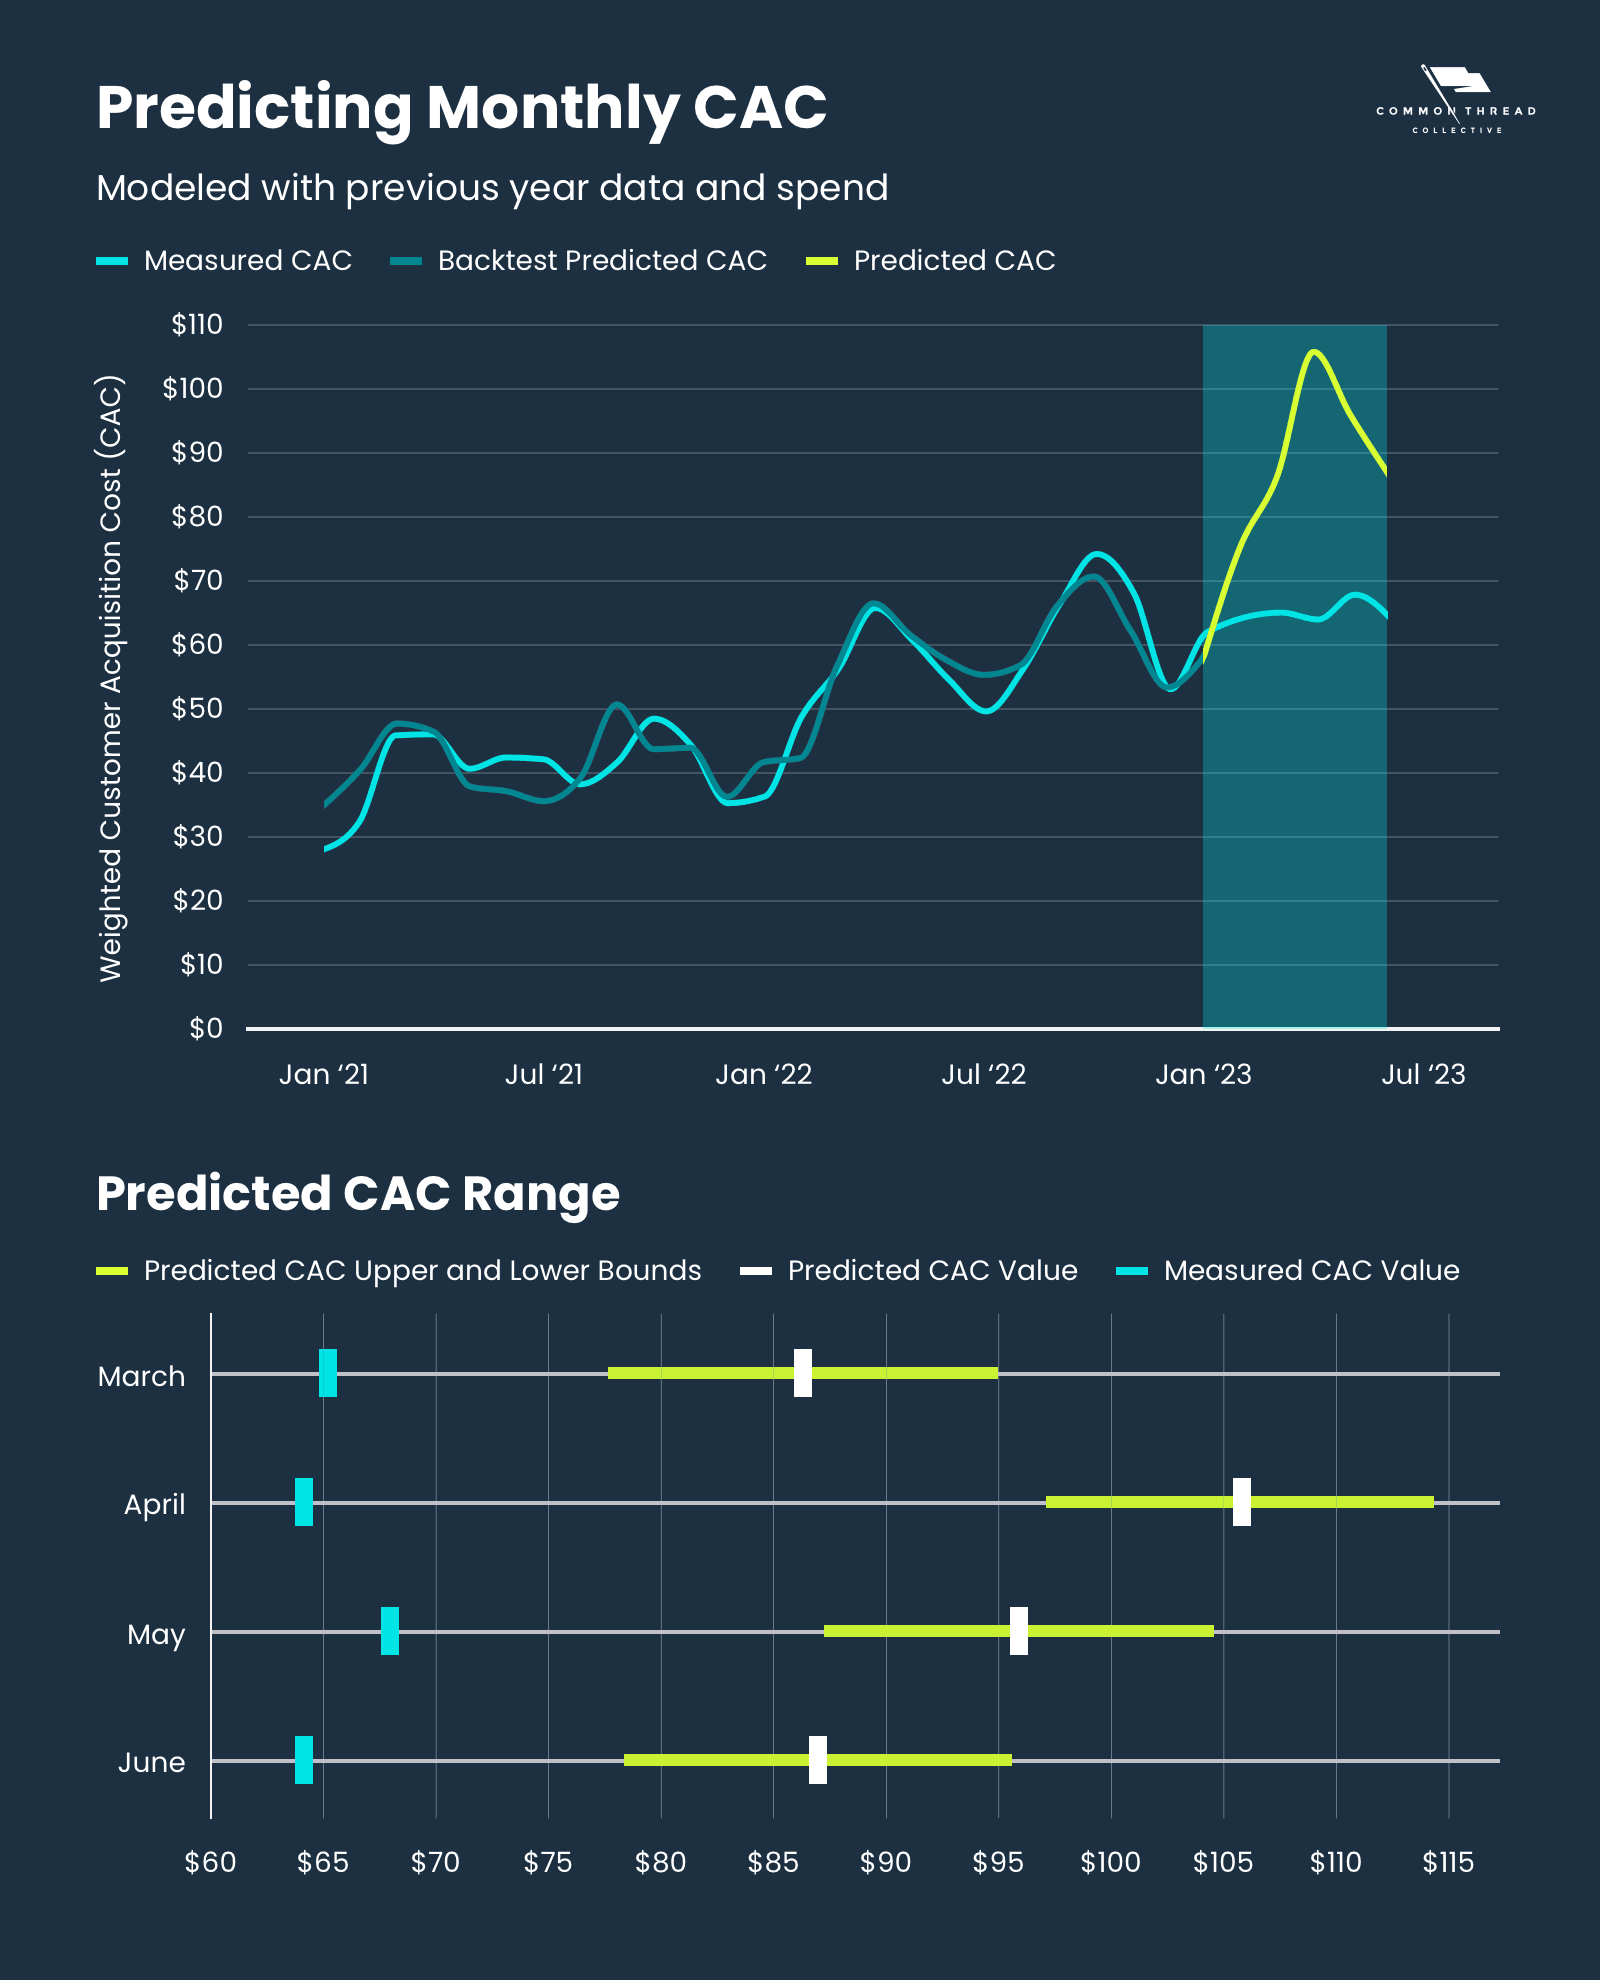
Lower-than-expected spend wasn’t the only issue — when we plug the actual spend numbers into our predictive model, our predictions are improved but still a way off from actual values:
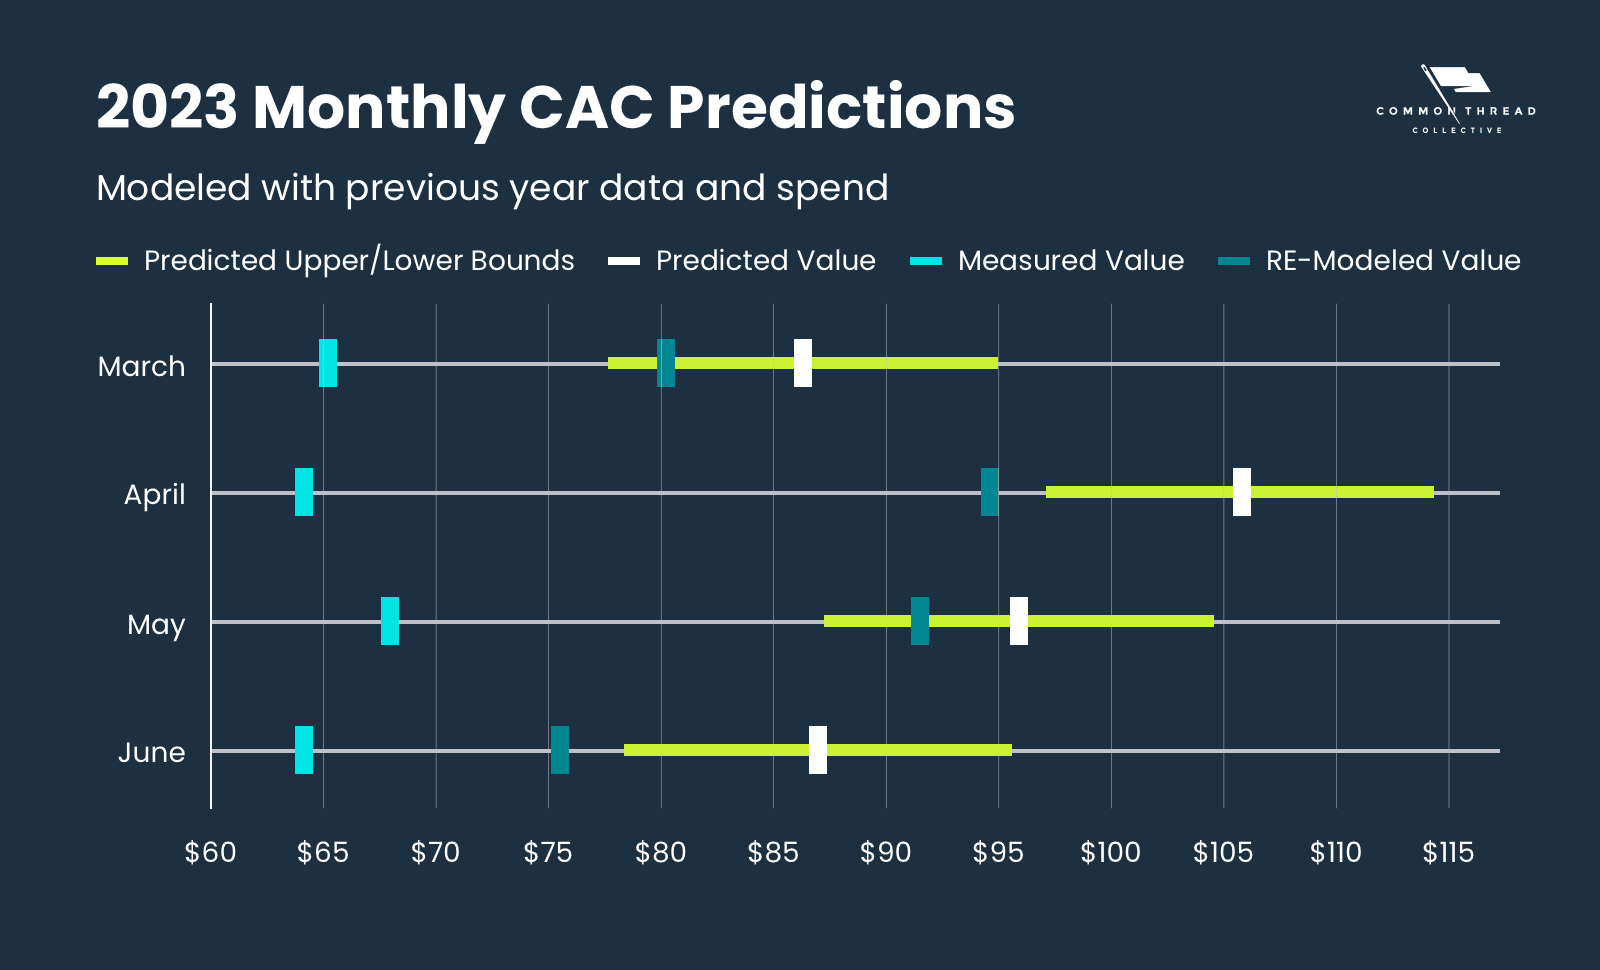
What we can say from these results is that the CTC team working on behalf of this brand achieved a significantly lower CAC compared to what our model predicted — even when adjusting for decreased spend:
March: $15.04 or +23.06% above the measured CAC
April: $30.30 or +47.24% above the measured CAC
May: $23.44 or +34.47% above the measured CAC
June: $11.38 or +17.76% above the measured CAC
We should be clear, however, that our model may not have adequately accounted for spend in relation to seasonality. We’ll come back to this in a bit.
But there’s another factor that could have made this model good at predicting the past in backtests (with a Mean Absolute Error of $2.45), but bad at predicting the future:
The future was not like the past.
Any meaningful model must use past events to predict the future. There’s only so much you can do to account for unexpected factors.
One of those factors is the performance bump most brands get from hiring CTC.
We haven't included the CTC bump in our model yet because it’s difficult to account for and likely includes a significant bias towards brands that still have us as an agency partner.
That said, it would probably be wise to adjust our models based on the first few months of performance from that brand.
Modeling accuracy generally degrades the further into the future the model predicts.
That’s exactly what happened when we modeled more than 1 month in advance.
That’s partially because we don’t know some of the variables impacting performance that far in advance: We can’t use CAC from the previous month, or consumer confidence, or number of other factors only available closer to month being modeled.
All of these factors could improve the model but are only available closer to the month being modeled.
One big issue with CAC modeling: There aren’t enough data points.
In this case, we have reliable data from the brand going back to January 2020. When we built this model in January of 2023, that gives us 3 years or 36 points to use in the model.
While that may seem like a sufficient number of points, it's far less than we would like.
Since so many variables affect CAC, the introduction of an unforeseen future circumstance has the potential to cause a model with too few points to miss significantly.
One of the best ways to increase the number of available data points:
Make it a daily model.
With 3 years of data from daily performance, we could have over 1000 data points instead of just 36.
The other advantage that daily models provide is a more direct relationship between spend and CAC.
This relationship can be hidden over the course of a month: A brand can spend a lot on one day, see that degrading efficiency and pull back for the rest of the month.
Brands that work with CTC develop a marketing calendar that schedules out new product launches, sales, and other notable revenue moments.
These events have important implications for acquiring new customers, but they’re also hard to quantify.
How important is a new product launch to a brand? Is it a whole new product line? Just a single product?
To pull this off, we’ll need to use historical marketing calendar events and quantify them. This will be arduous, but it’s likely necessary for a good model.
A brand’s ability to acquire customers to their particular product is related to the interest in their brand and their product category as a whole.
I believe that Google Search Volume is a good proxy for customer interest.
We actually did this for the brand modeled above to find their Total Available Impressions for their search terms over time.
Here’s that brand’s Quarterly revenue plotted against Quarterly Google Search Volume:
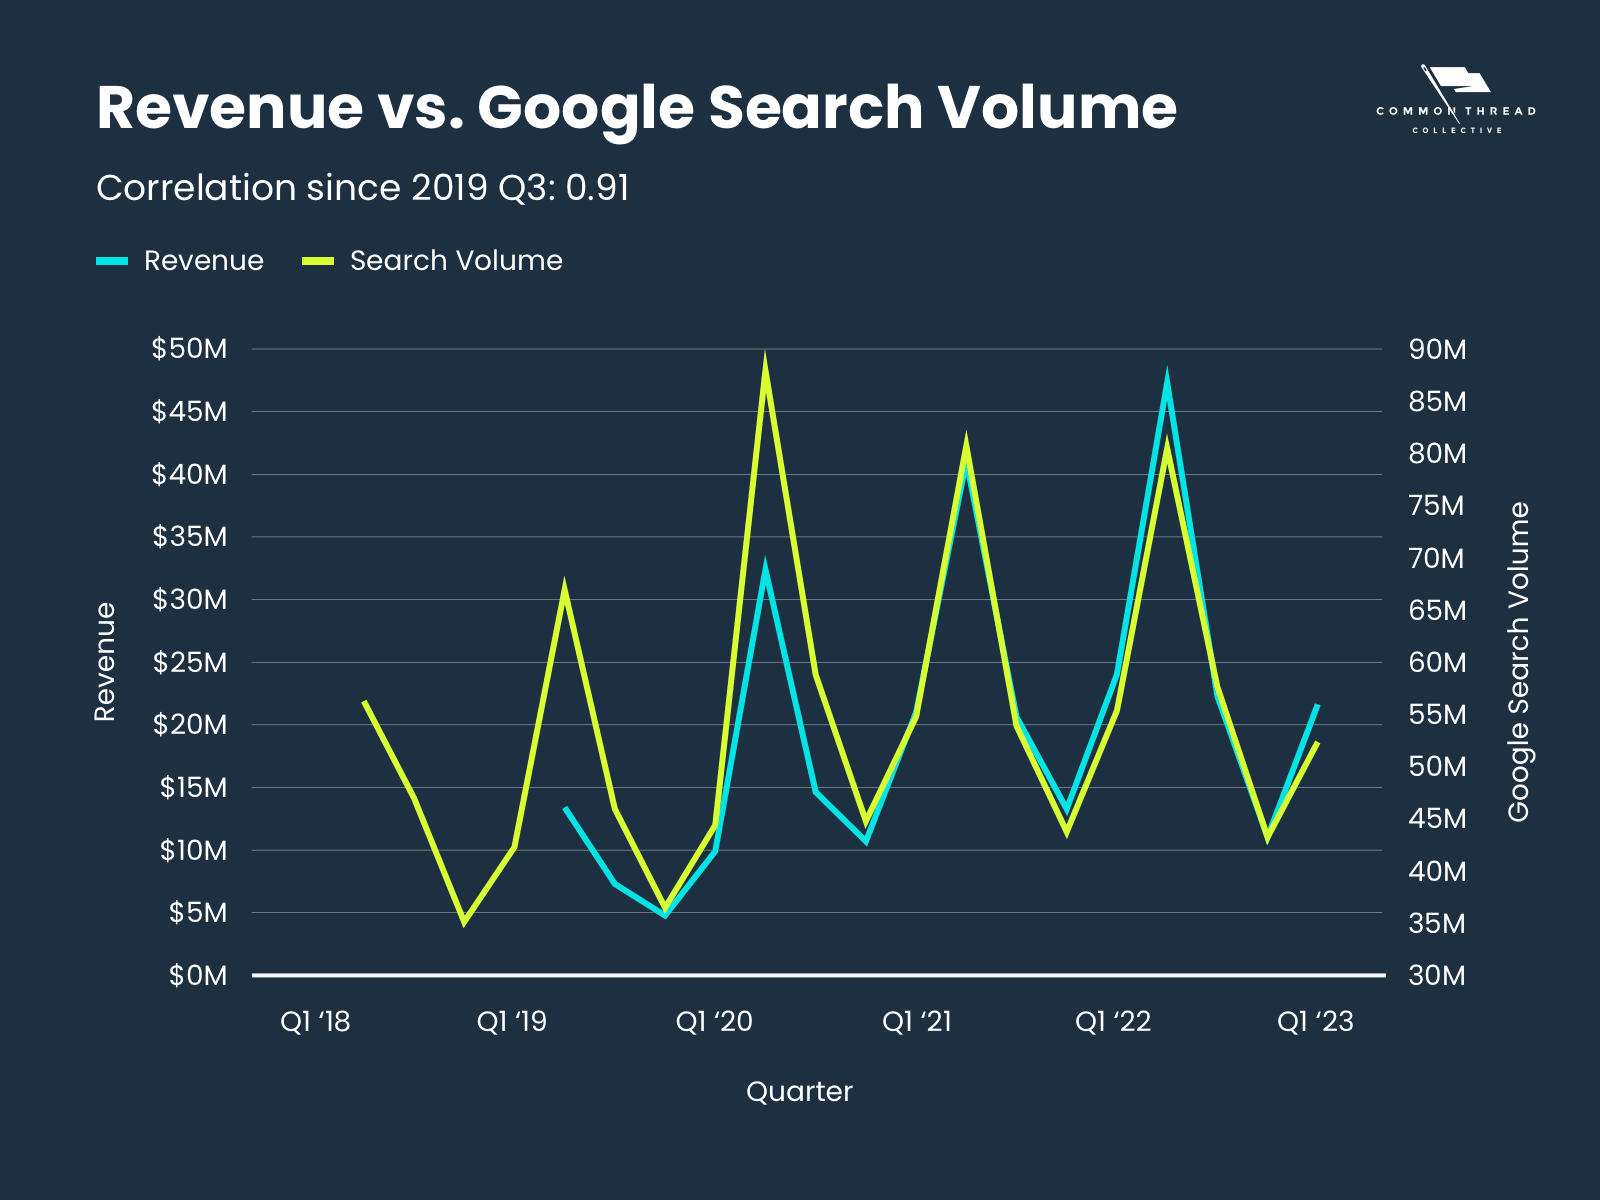
The chart is clear:
There’s a very strong correlation between the two metrics.
We performed a similar analysis for another brand. We compared the ratio of CAC to Spend to Brand Search Volume.
We found a good negative correlation:
If Brand Search Volume was higher, then CAC didn’t grow as quickly with increased spend.
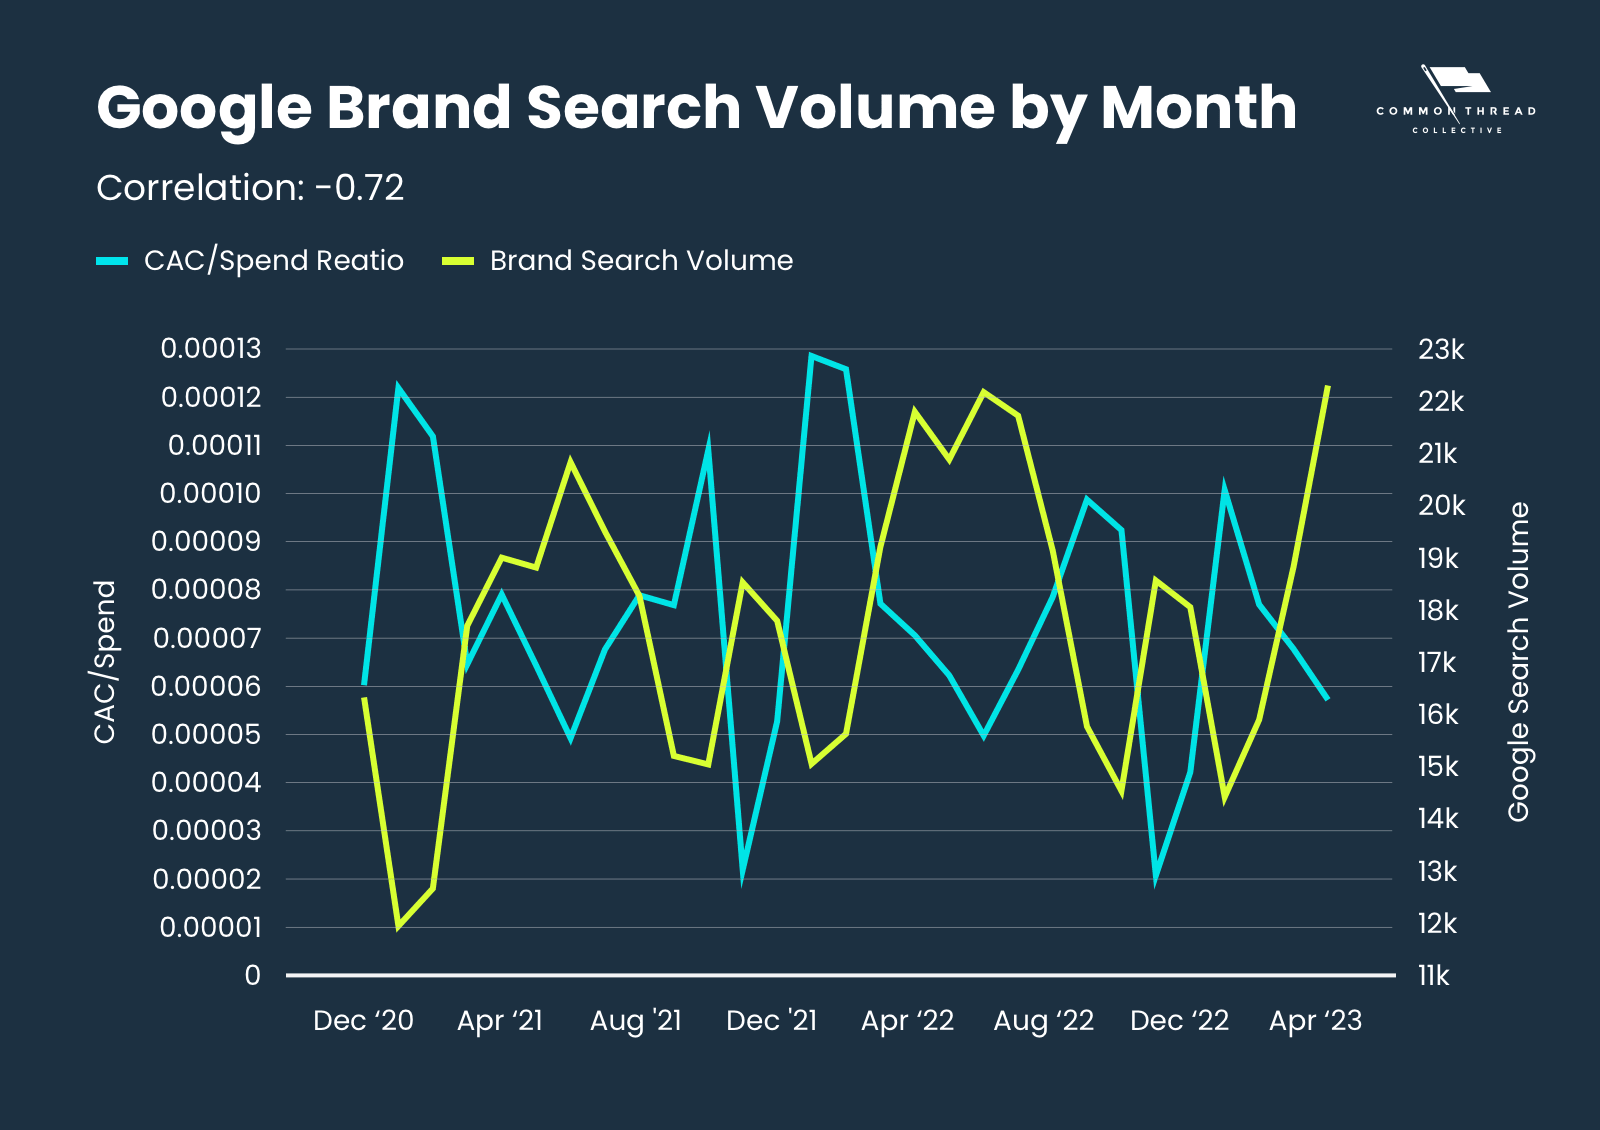
Using a Fourier Transform, we built a model that predicts Google Search Volume, allowing us to anticipate both revenue and CAC.
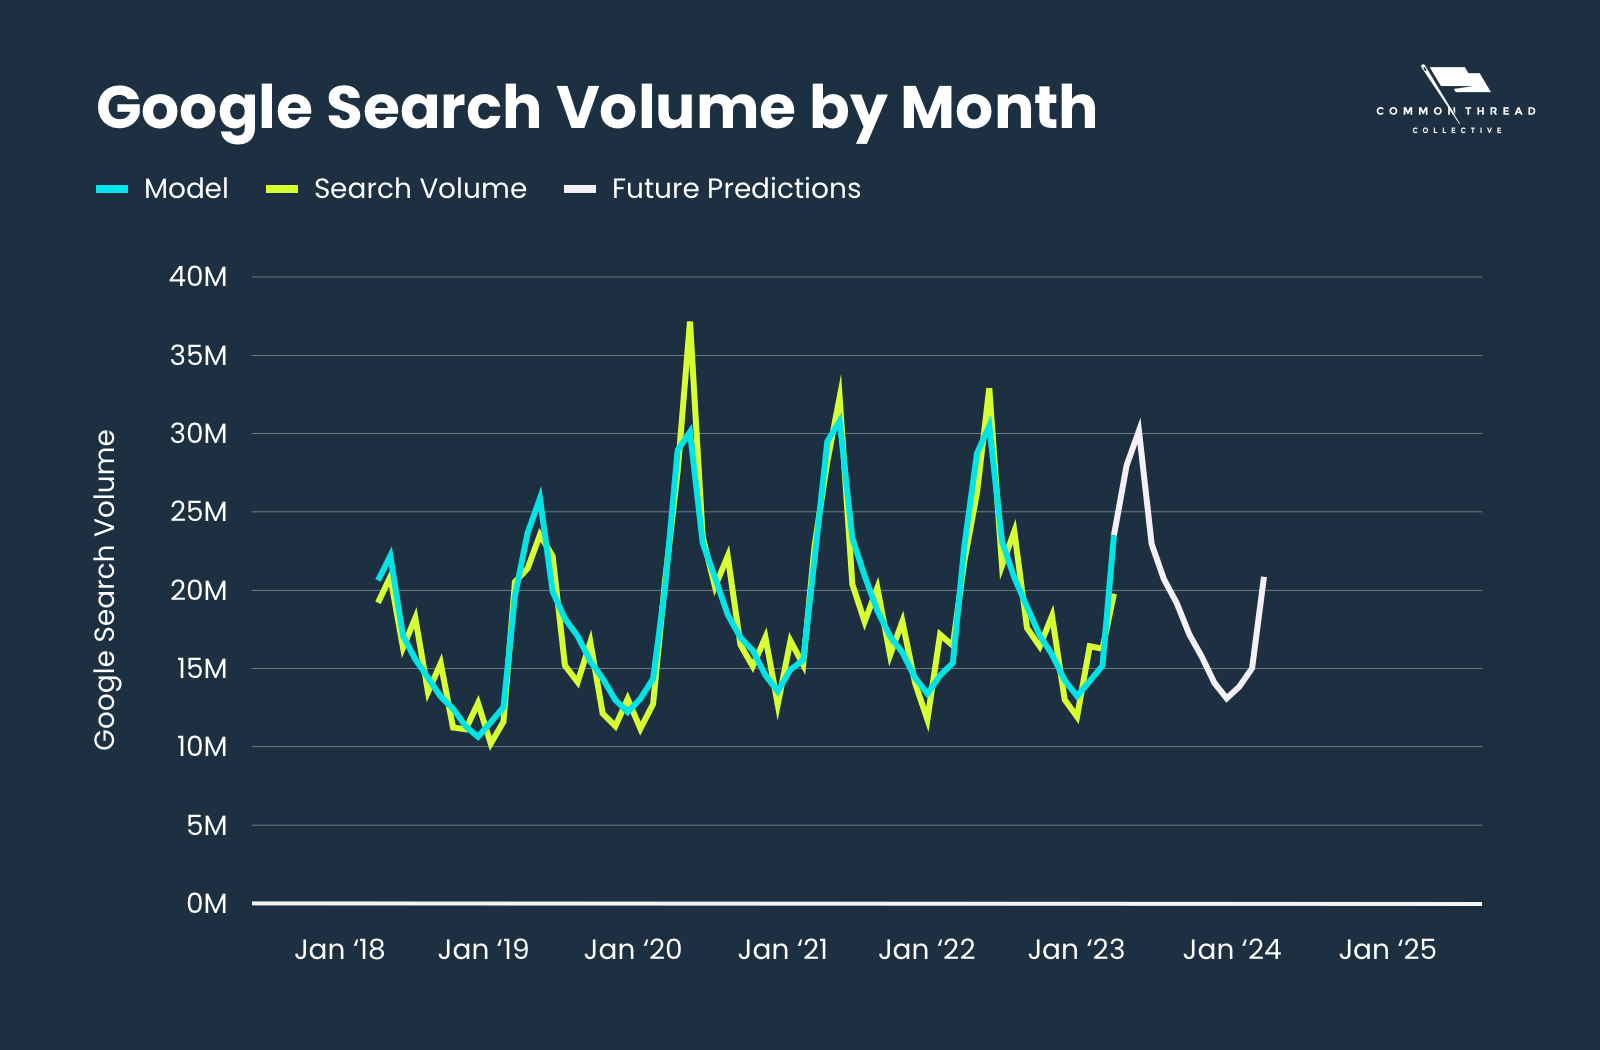
Although it looks promising, we’ll need a few more months of data to confirm its accuracy.
Thus far, we’ve focused on CAC modeling because it forms the basis of our forecasting system.
There may, however, be better metrics to model.
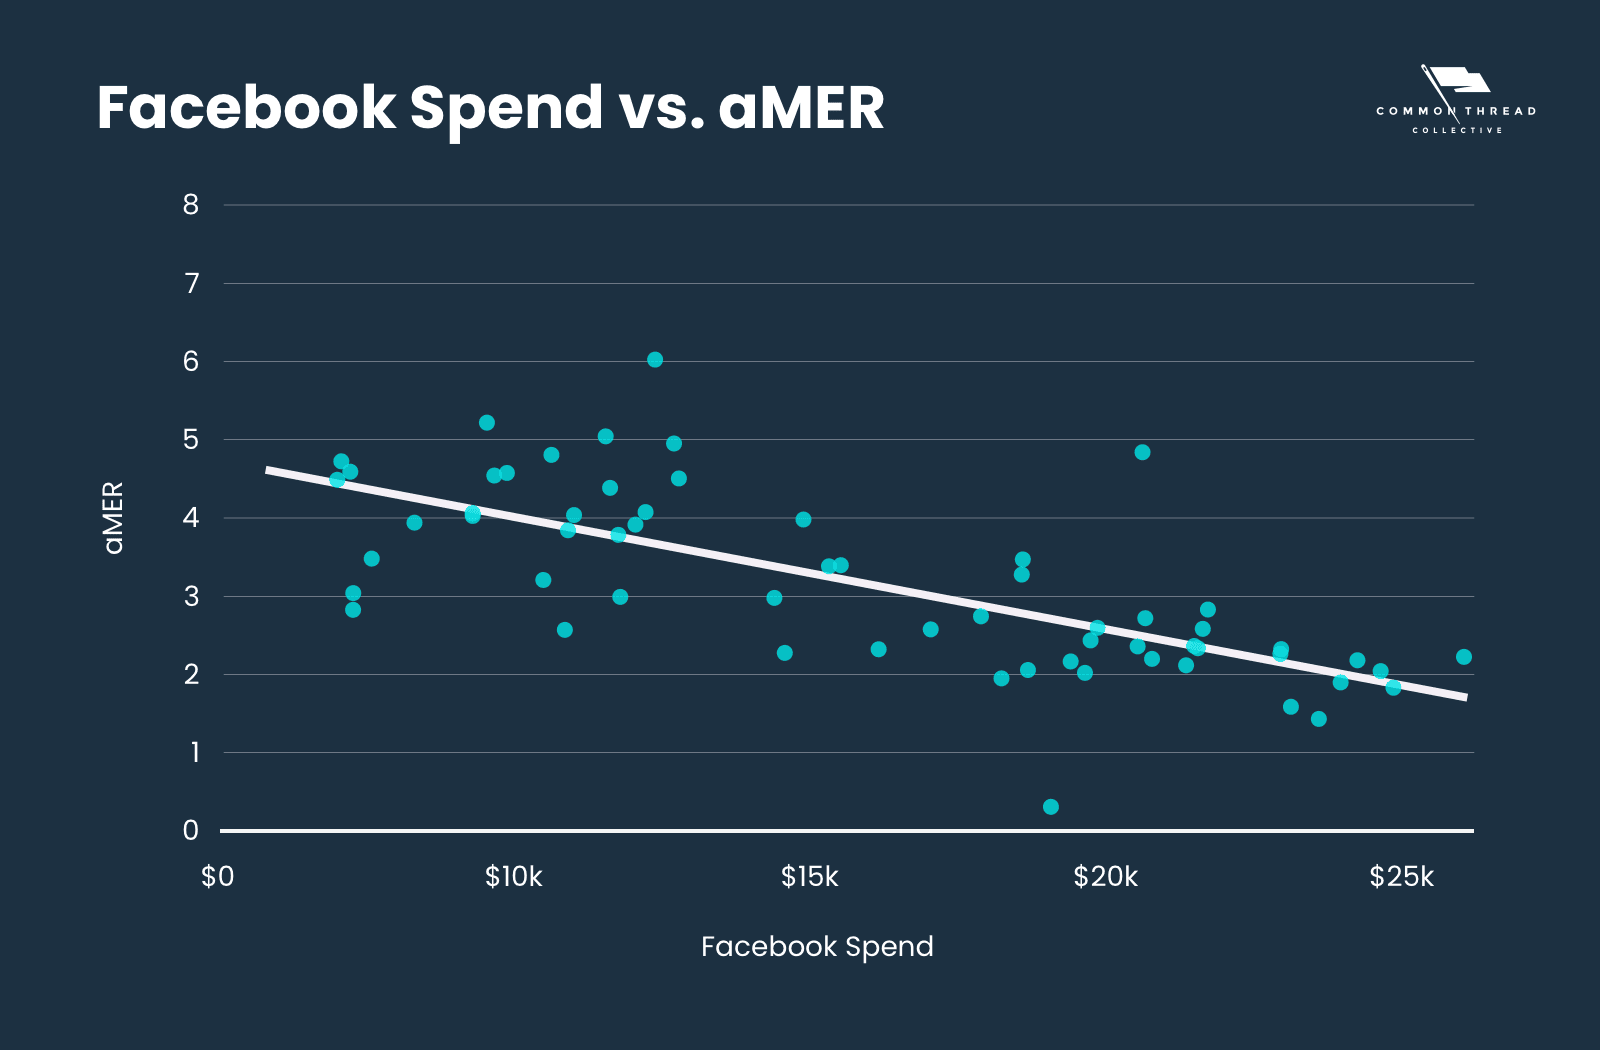
While analyzing a Fashion & Apparel brand, we noticed that CAC was roughly correlated with First Order Revenue (nAOV).
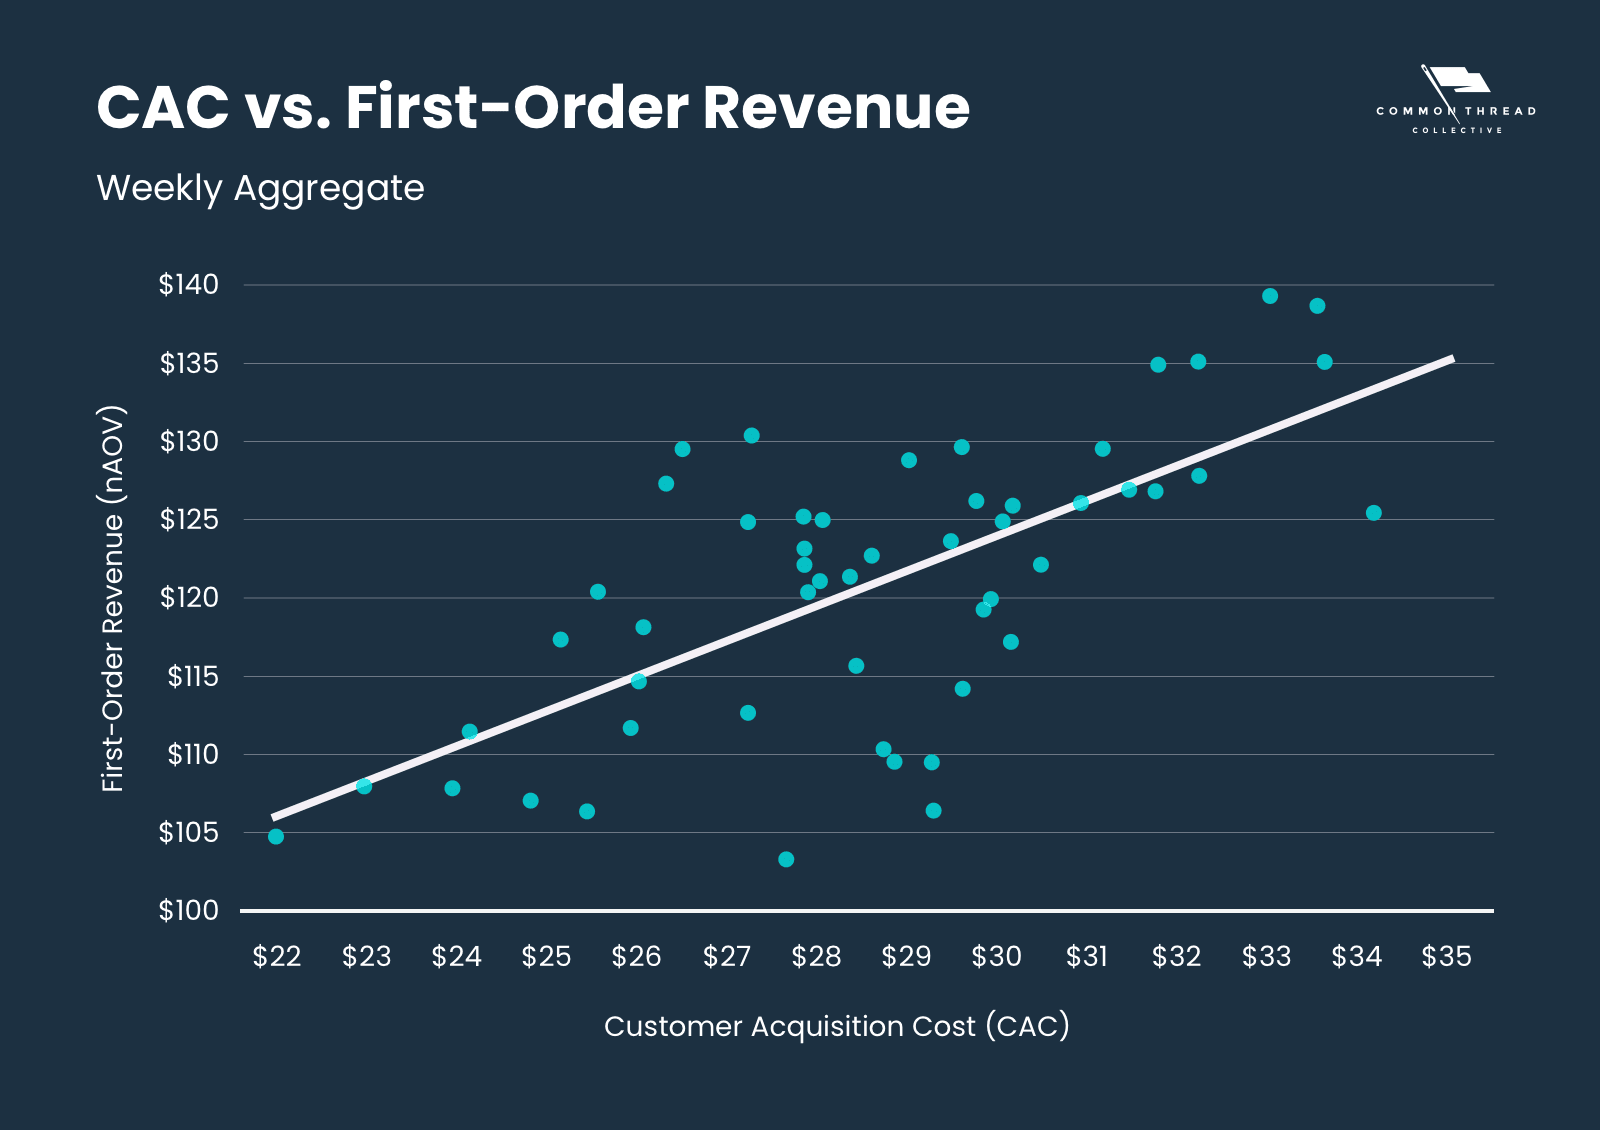
If customers were purchasing higher value products, it took more ad spend to acquire those customers; likewise, the brand was willing to accept a higher CAC with a corresponding higher nAOV.
So, if nAOV and CAC move together, it might make sense to model a metric that combines both of those.
This is where we welcome back an old metric that we’ve used before: Acquisition Market Efficiency Ratio (aMER = Total New Customer Revenue / Total Spend).
This metric lets marketers know how efficient they’re acquiring new customers.
We are starting to apply this model to brands but haven’t yet improved this model enough to publish.
Stay tuned as we continue to make improvements to these models and better understand what it takes to acquire customers.

27 Key Metrics, Updated Weekly
From store CAC to Facebook ROAS, the DTC Index contains charts tracking year-over-year data points from all parts of the funnel.
Subscribe Now
Steve Rekuc is the Ecommerce Data Analyst at Common Thread Collective. Based in Vail, Colorado, he has been analyzing data from a systems perspective since his time as a graduate student at Georgia Tech two decades ago. Steve can be found on Twitter and LinkedIn examining data and providing interesting insights into ecommerce, marketing, and data analysis.