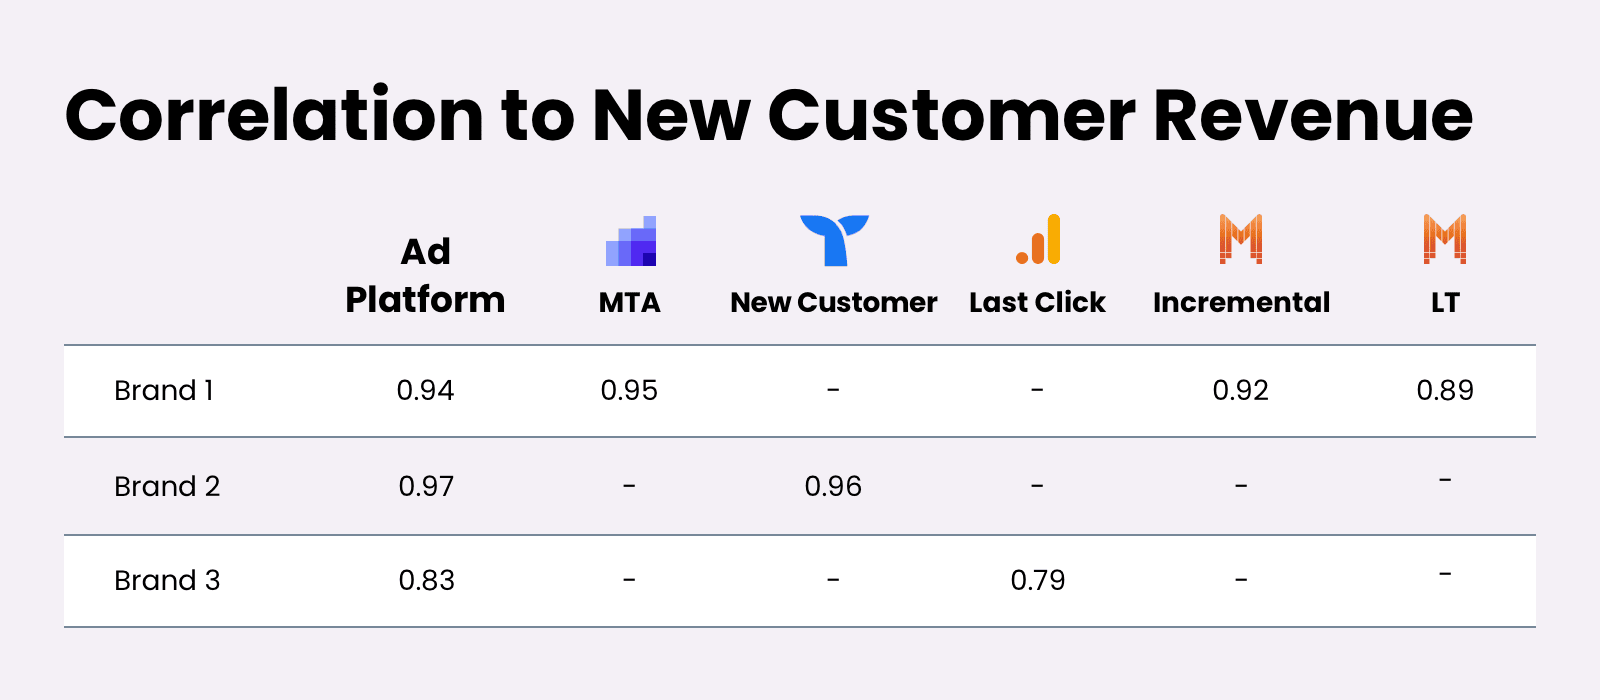
That headline above says it all:
Attribution platforms’ MTA & incrementality models are redundant and don’t offer unique insight in driving new customer revenue.
Bear with us on the bold claim, because this analysis just might save you a lot of time and money.

Over this past year in particular, we’ve had more conversations surrounding attribution than we could ever hope to count.
If you were following along on Twitter, these conversations were informally known as “The Great Attribution Wars of 2022.”
The genesis of the Attribution Wars, however, came with the 2021 release of iOS14, throwing the accuracy of Facebook’s attribution into serious question.
In the midst of that data obscurity, brands scrambled to find an alternative, a third-party attribution platform that could shed light on whether or not their Facebook campaigns were actually working.
Since then, third-party attribution platforms’ utility has expanded; the main goal is understanding where new customer acquisition ad dollars are most effectively invested.
Brands are trying to answer three key questions:
- Which platforms are we underinvested in?
- Which channels are we overinvested in?
- What intra-channel optimization decisions will improve our efficiency?
Through countless hours of discussions surrounding this topic, we discovered a bigger question at the heart of these three:
If our goal is to drive new customer revenue growth as effectively as possible, which data signal is most closely correlated to that outcome?
We decided to structure a test to get to the bottom of this once and for all.
More of an auditory learner?
We talk about this entire experiment and its implications on the latest episode of our podcast, The Ecommerce Playbook. Listen to learn more.
The Experiment
If you don’t care about the setup and just want the results, click here.
To set up the test, we pulled weekly data from Jan. 1st 2022-March 31st 2023 across a number of different brands and attribution platforms including Rockerbox, Measured, Triple Whale, and Google Analytics.
For each platform, we pulled their respective model’s attributed revenue for Meta and Google Pmax/Shopping (excluding Google Brand Search), and ran a correlation between the platforms’ attributed Acquisition Revenue and the brand’s total New Customer revenue over the same time period.
Here’s a summary of the test structure:
We defined “Acquisition Revenue” as revenue from Meta + revenue from Google NB+PMax/Shopping.
Then, we pulled Acquisition Revenue from the following platforms, and correlated each against aMER.
- Meta 7d click platform
- Google (excl. BRD) platform
- Rockerbox MTA
- Triple Pixel New Customer
- GA Last Click
- Measured Incremental
- Measured LT
In summary, this analysis looked across 70 weeks of time and thousands of rows of data, for a number of different $10-100M+ brands across 6 different attribution models.
In all that data we were looking for the answer to one question:
“Which platform’s attributed Acquisition Revenue correlates most strongly with actual New Customer Revenue?”
The Results
Luckily we were able to answer that question confidently.
The following summary shows the Pearson correlation coefficient for a few of those brands, comparing each attribution model’s attributed Acquisition Revenue in relationship to the brand’s Total First Time Customer Revenue:

The Data is Clear:
Ad Platform attributed revenue has just as strong, or stronger, a correlation with driving New Customer revenue on a weekly basis than any of the other attribution models.
So, let’s go back to the core question: If our goal is to drive new customer revenue growth as effectively as possible, which data signal is most closely correlated to that outcome?
The Answer:
Meta and Google’s on-platform attribution is most closely correlated to actual new customer revenue growth.
This is good news, because
- Those attribution models are free, and
- This negates the need for inserting an auxiliary data signal into the optimization process.
That second point is the most important one; introducing an additional data point into the decision-making process, comparing that metric to the on-platform reads and then trying to triangulate the signals against each other to make a decision adds costly layers of time and complexity.
Further, Meta and Google Ads can only optimize off their own signals, not off of an outside signal. So when you add in these other layers of metrics and data in the optimization process, you end up with an acquisition funnel that operates like this goalie:
What About New Customer Revenue?
This all sounds conclusive so far, but there’s a second function that many brands use third party platforms for:
Understanding the percentage of new customers vs. returning customers coming through their ad campaigns.
Of course, even with the tightest existing customer and past purchasers exclusions, some amount of returning customers will sneak in through acquisition campaigns.
Among other reasons, this is due to platform signal loss, match rate limitations, and data files being incomplete.
But we’ve figured out how to see the channel and campaign new customer percentage without the need for a 3rd-party attribution tool, and all based on 1st-party data …

Our Statlas team discovered that Shopify removed the Developer Preview tag recently from their Web Pixel API.
This means you can now access the Shopify Pixel API and pull first-party Pixel data for all users across all touchpoints of the Shopify journey.
With this, we can see which channel Shopify users come from, every specific action they took after visiting the Shopify website, and if they are a new or returning customer.
This is incredible because it allows us to understand what percentage of new and returning customers are driven from each channel and campaign, and to access that directly via Shopify first party pixel data rather than through a 3rd party attribution provider:

This chart shows the resulting data for Bambu Earth, and a breakdown of New Customer Orders and Returning Customer Orders per channel based on a 7d click attribution window.
In this particular example, we can see that at least 10% of the orders from our new customer acquisition Meta campaigns are actually from returning customers — which lines up closely with the most recent number Meta has shared in terms of the current signal loss impact.
Channel Budget Allocation Strategy
There’s still one more possible justification for using a third-party platform:
Budget allocation.
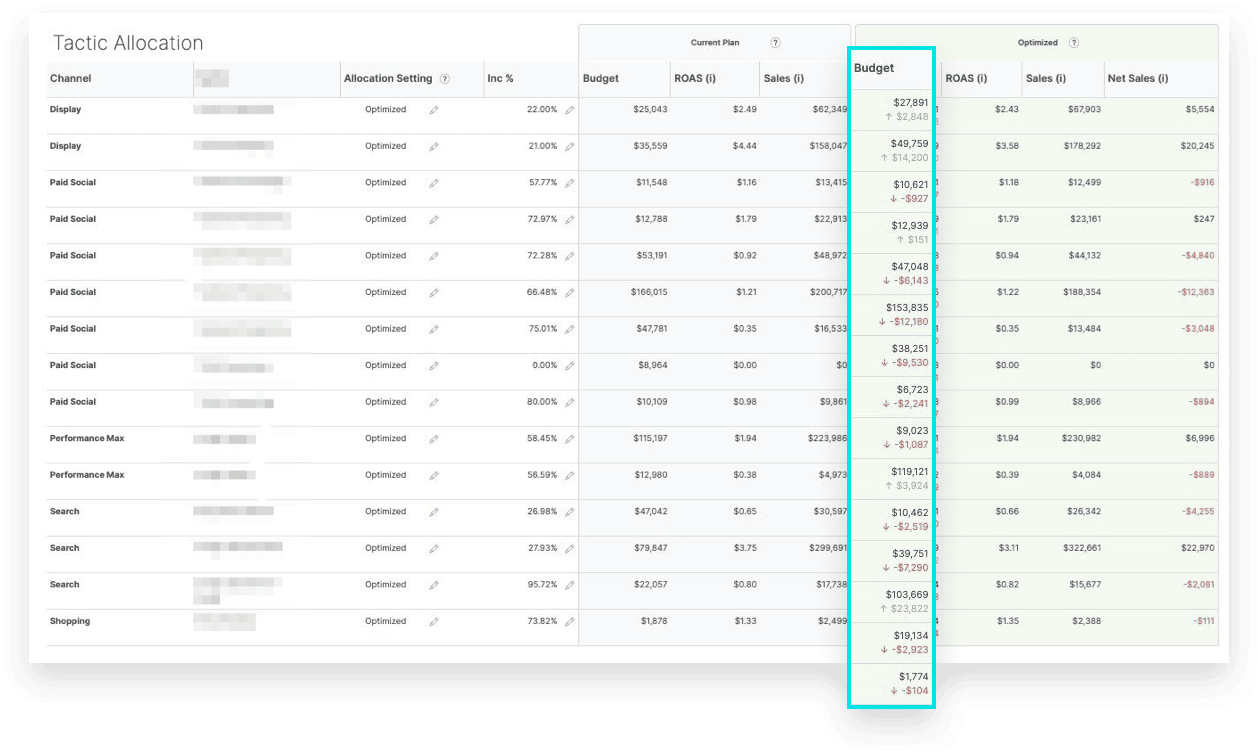
Here’s an example of how an attribution or incrementality platform might make budget allocation recommendations across your channels (example from Measured’s budget planning tool):

As you can see, the recommendation is to increase Google Brand Search and Display budget allocations.
What we all know, however, is that these two channels do not provide additional demand upside.
For example, Google Brand Search is maxed out at 100% impression share, we are fully delivering there, and making budget increases to that channel isn’t going to make an incremental impact.
In other words, you still need thoughtful, contextualized decisionmaking to inform budget allocation, even if you’re using incrementality planning tools.
Our approach to budget allocation is based on what we see work most effectively across the 300+ brands and >$4 billion in TTM revenue we manage across our data set.
And it doesn’t require the introduction of a pricey and redundant attribution or incrementality platform.
At the core of our strategy is a belief in the prioritization of channel focus.
Meanwhile CMO of Hubspot and CEO of Butcher Box…
— Taylor Holiday (@TaylorHoliday) April 12, 2023
“You need 1 channel to get to $50M and 2 channels to get to $100M.”
Channel diversification is a siren song of death for so many smaller brands. https://t.co/ldx0udZ71k pic.twitter.com/R3bbIxDsPd
Time and time again, the brands that grow most profitably are the ones that focus on a few core strategies and platforms that lend to the brand’s strengths, rather than spreading their time, focus, and resources across a variety of channels.
And for most <$100M DTC ecomm brands, this means focusing on Meta and Google for customer acquisition.
With that focus in mind, we’ve found these budget allocation parameters to be most effective:
1. Maximize Brand Search Impression Share at the lowest cost possible.
Build this campaign with exact match terms, on a target impression share bid strategy, with a max CPC bid limit.
2. Maximize Demand Capture spend.
Spend as much as you can on Google Performance Max/Shopping campaigns at the ROAS target you’ve set for this channel.
3. Maximize Demand Creation spend.
Spend as much as you can on Meta Acquisition campaigns at the ROAS target you’ve set for this channel.
Simple as that.
Wrapping It Up
Meta and Google’s on-platform attribution is the data signal most closely correlated to the outcome of driving new customer revenue growth.
If that outcome is the goal, then attribution platforms’ MTA & incrementality models are redundant and don’t offer unique insight in driving new customer revenue vs. on-platform attribution.
In other words, 3rd party attribution tools:
- Don’t have as strong a relationship to new customer revenue as the ad platforms themselves
- Offer insights that are already available to you for no extra charge
- Can’t be optimized against by Facebook’s algorithm
The Upshot is Clear:
You don’t need a 3rd party tool to make channel allocation and platform optimization decisions.
You do need to set thoughtful channel targets, and then let the platforms’ reported attribution guide you to simple, focused, decisionmaking that eliminates extra noise at all costs.

As the Director of Growth Strategy at Common Thread Collective, Luke Austin leads our team of Growth Strategists working with some of the most exciting $100M+ consumer ecommerce brands in the industry. Connect with him on Twitter.
