Ready to identify your brand's next step?
Get the Toolkit

The Ecommerce Diagnostic Toolkit

From Common Thread Collective
The Ecommerce Diagnostic ToolkitThe Ecommerce Diagnostic Toolkit

How would it change the way you run your business if you could …
precisely identify your weak points?

The Ecommerce Diagnostic Toolkit is an interactive assessment that identifies your business’ growth potential.

Using 10 key metrics, the Diagnostic Toolkit shows you the unexpected factors that affect your growth.

Is this you?

  • “My business has been doing fine up to this point … but now revenue is plateauing and my old growth tactics aren’t working anymore.”
  • “All of our topline performance metrics look great. But at the end of the day we’re still losing money on the bottom line.”
  • “Growing this business has been a struggle and I feel like I’ve run out of ideas. What should I do next?
If any of that sounds familiar, then …

The Ecommerce Diagnostic Toolkit is for you.

We designed the toolkit because we’ve seen it all before.

Common Thread Collective is an ecommerce growth agency that specializes in growing businesses past $100M in annual revenue.

After 12 years in ecommerce, we realized that we needed a clear rubric for assessing where clients’ greatest growth opportunities lay.

Watch Common Thread Collective CEO Taylor Holiday and Digital Product Director Richard Gaffin identify the biggest growth issues for our own skincare brand:

And we don’t just use this methodology on our own brands — we start every client journey by measuring their growth potential against the metrics inside the Ecommerce Diagnostic Toolkit.

  • APL
  • TravisMatthew
  • Native
  • OluKai
  • Heart and Soil
  • Buffy
  • Italic
  • Skullcandy
  • '47 Forty Seven
  • Igloo
  • Liquid Death
  • Duke Cannon Supply Co.

Here are the 10 Metrics that define a fast-growing brand:

ecommerce shopping illustration

Here are the 10 Metrics that define a fast-growing brand:

  1. COD %

    Your cost of delivery (all variable costs) as a percentage of revenue.

  2. OPEX %

    Your operating expenses (all fixed costs) as a percentage of revenue.

  3. CCC

    Your Cash Conversion Cycle: The number of days it takes to turn invested cash into < cash on hand.

  4. 60-Day LTV %

    The average % increase in customer value 60 days after first purchase.

  5. 1-Year LTV %

    The average % increase in customer value 365 days after first purchase.

  6. FOV:nCAC

    The ratio of first-order value to new-customer acquisition costs.

  7. # Distribution Channels

    How many revenue sources your brand has (e.g. ecommerce, wholesale, brick-and-mortar).

  8. Organic Traffic %

    The percentage of traffic that comes from organic, rather than paid, sources

  9. 1-Year LTV:nCAC

    The ratio of 1-year customer value to new-customer acquisition costs.

  10. Revenue Peaks

    The number of months in the year where revenue outperforms the mean by at least 25%.
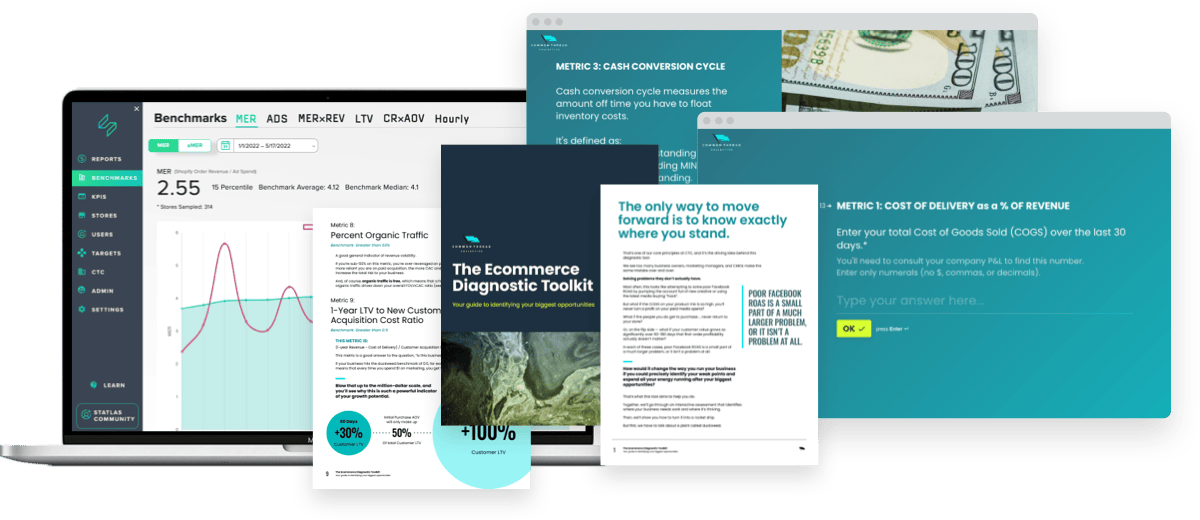
We use these metrics to calculate your Growth Quotient (GQ).

If your Growth Quotient is at or above 130, you're piloting a rocket ship. If you’re below 130, there are some clear next steps you’ll need to take to maximize your revenue potential.

You’ll go from
“What do I do next?” to …

  • “Poor Facebook ROAS isn’t an issue … because my value capture over 60 days is so good. Time to push Facebook spend and lean into retention marketing.”
  • “My marketing won’t matter until I cut operating costs. We’re carrying way too much baggage to get profitable growth. But once I do … we’re going to the moon.”
  • “We’re waaay overleveraged on paid social. I have to focus on organic revenue growth to make this work.”

Enter Your Data. Get Your Results. Build Your Strategy.

Buy the Toolkit

“So what’s in this Diagnostic Toolkit, anyway?”

Glad you asked. The Ecommerce Diagnostic Toolkit comes in three parts:

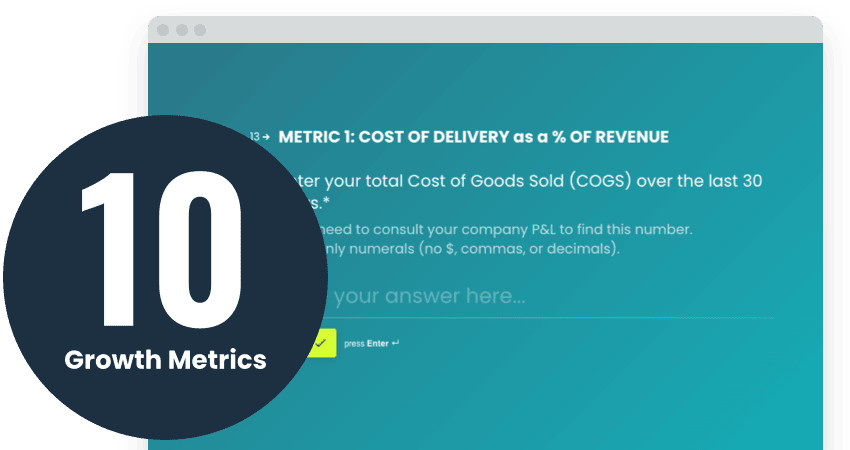
1. Enter your data

Plug key brand data into our step-by-step workflow, and we’ll automatically calculate the 10 growth metrics for you.

Enter your data

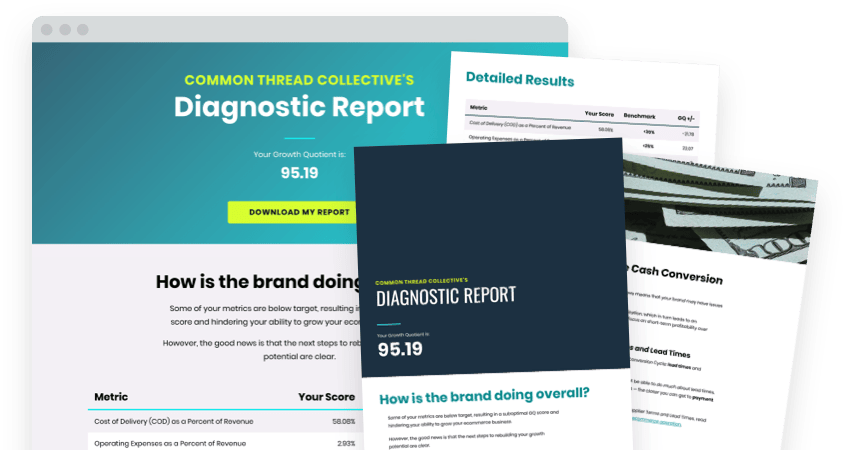
2. Get your growth score

Once it’s submitted, you’ll get a downloadable report laying out your performance against each benchmark.

Get your growth score

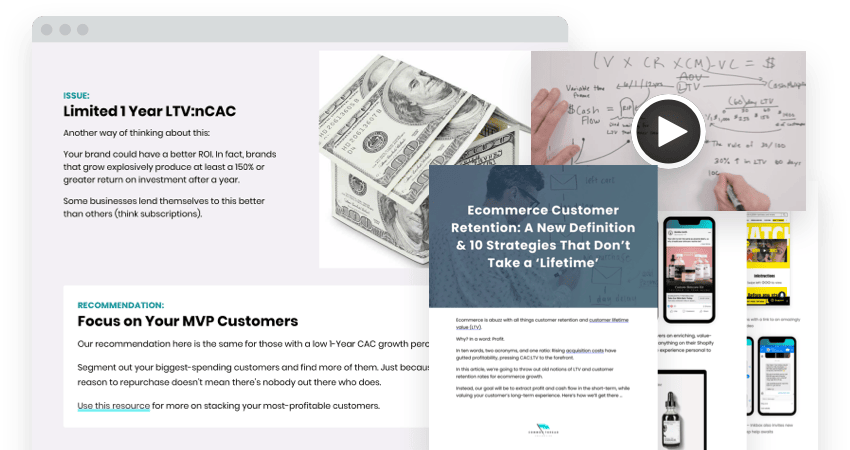
3. Take your next steps

Included in the report: directional guidance on what to actually do now that you understand where your brand needs improvement.

Take your next steps

Plus as an added bonus, you also get FREE access to …

Statlas

Data at your fingertips

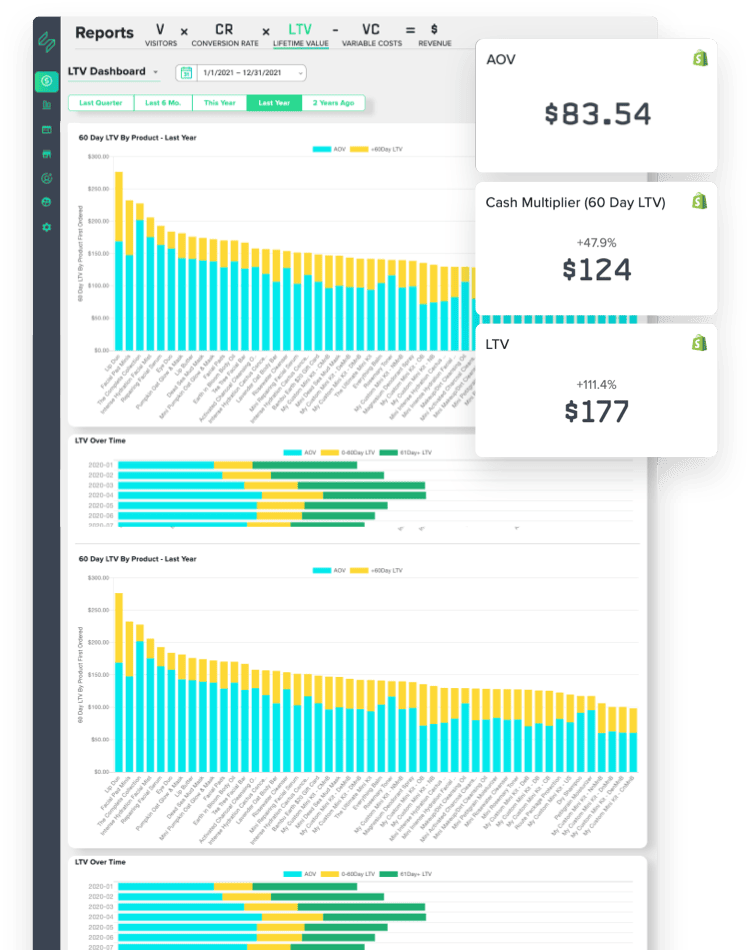
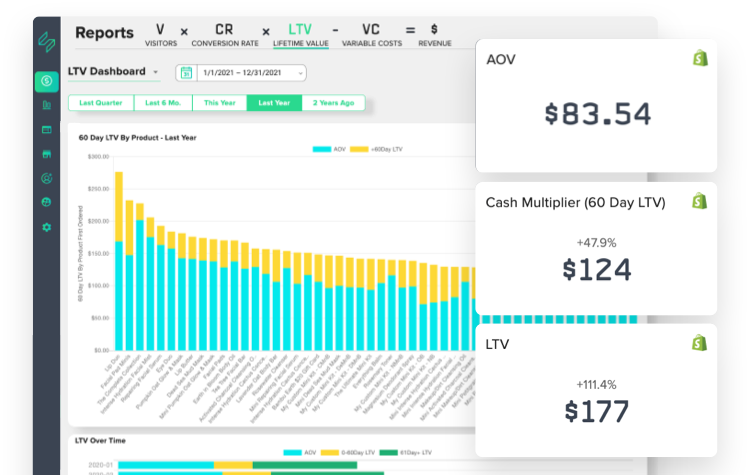
Get a 30-day free trial of Statlas — our proprietary data analysis tool.

Statlas is critical to entering data into the diagnostic correctly. You can do the assessment without Statlas … theoretically. But it’ll make finding the data points you’ll need — metrics that most businesses don’t use or even know about — much easier.

Statlas dashboard previewStatlas dashboard preview