Ecommerce Analytics: How to Find Growth Opportunities with Consolidated Data, Benchmarks & Three ‘Layers’ of Revenue

by Peter Hassan
Feb. 16 2022
It’s a problem ecommerce businesses know well. Especially growing businesses.
You launch. Slog your way to $5-$10 million in annual revenue. You scale, smashing your metrics on the back of product-market fit along with one or two strong channels.
If you’re really on top of your game, you do it all profitably.
Then … it breaks.
After years of success, suddenly your business stagnates. Worse, you don’t know why. Two questions haunt you: “What happened? What should we do?”
Good news, businesses don’t break. Parts of businesses break. Meaning, the key to unlocking new growth always comes from diagnosing your exact problems through data.
In this article, we’re going to walk through Statlas — our in-house ecommerce analytics tool — to show you how we find new opportunities for clients as well as the DTC brands we ourselves own.
But don’t get fooled. The point isn’t Statlas; the point is …
Consolidating your ecommerce data into three layers of revenue 🎂
I know, managing your data can be painful.
Shopify numbers in one place; paid, organic, and email elsewhere. Plus, let’s not even talk about the separate teams assigned to each analytics platforms with different analytics reports.
To grow your business exponentially you need clear access to historical, cohort-specific, customer data in real time.
Access, however, is only half the story. The other, equally important part is how you stack it into one cohesive masterpiece — like “cake.”
Cake is our visual representation of future revenue in three layers, moving from reliable (bottom layer) to volatile (top):
- Bottom Layer: Existing Customers
- Middle Layer: Owned Audiences
- Top Layer: Paid Acquisition
Bringing all that ecommerce reporting together into actionable strategies will be our mission. To get there, we’ll cover a lot of ground.
That’s why we’ve compiled everything into one downloadable guide you can save for later or share with your team. Let’s dig in …
Bottom Layer: Existing Customers
Cohort-Specific LTV & Product Performance
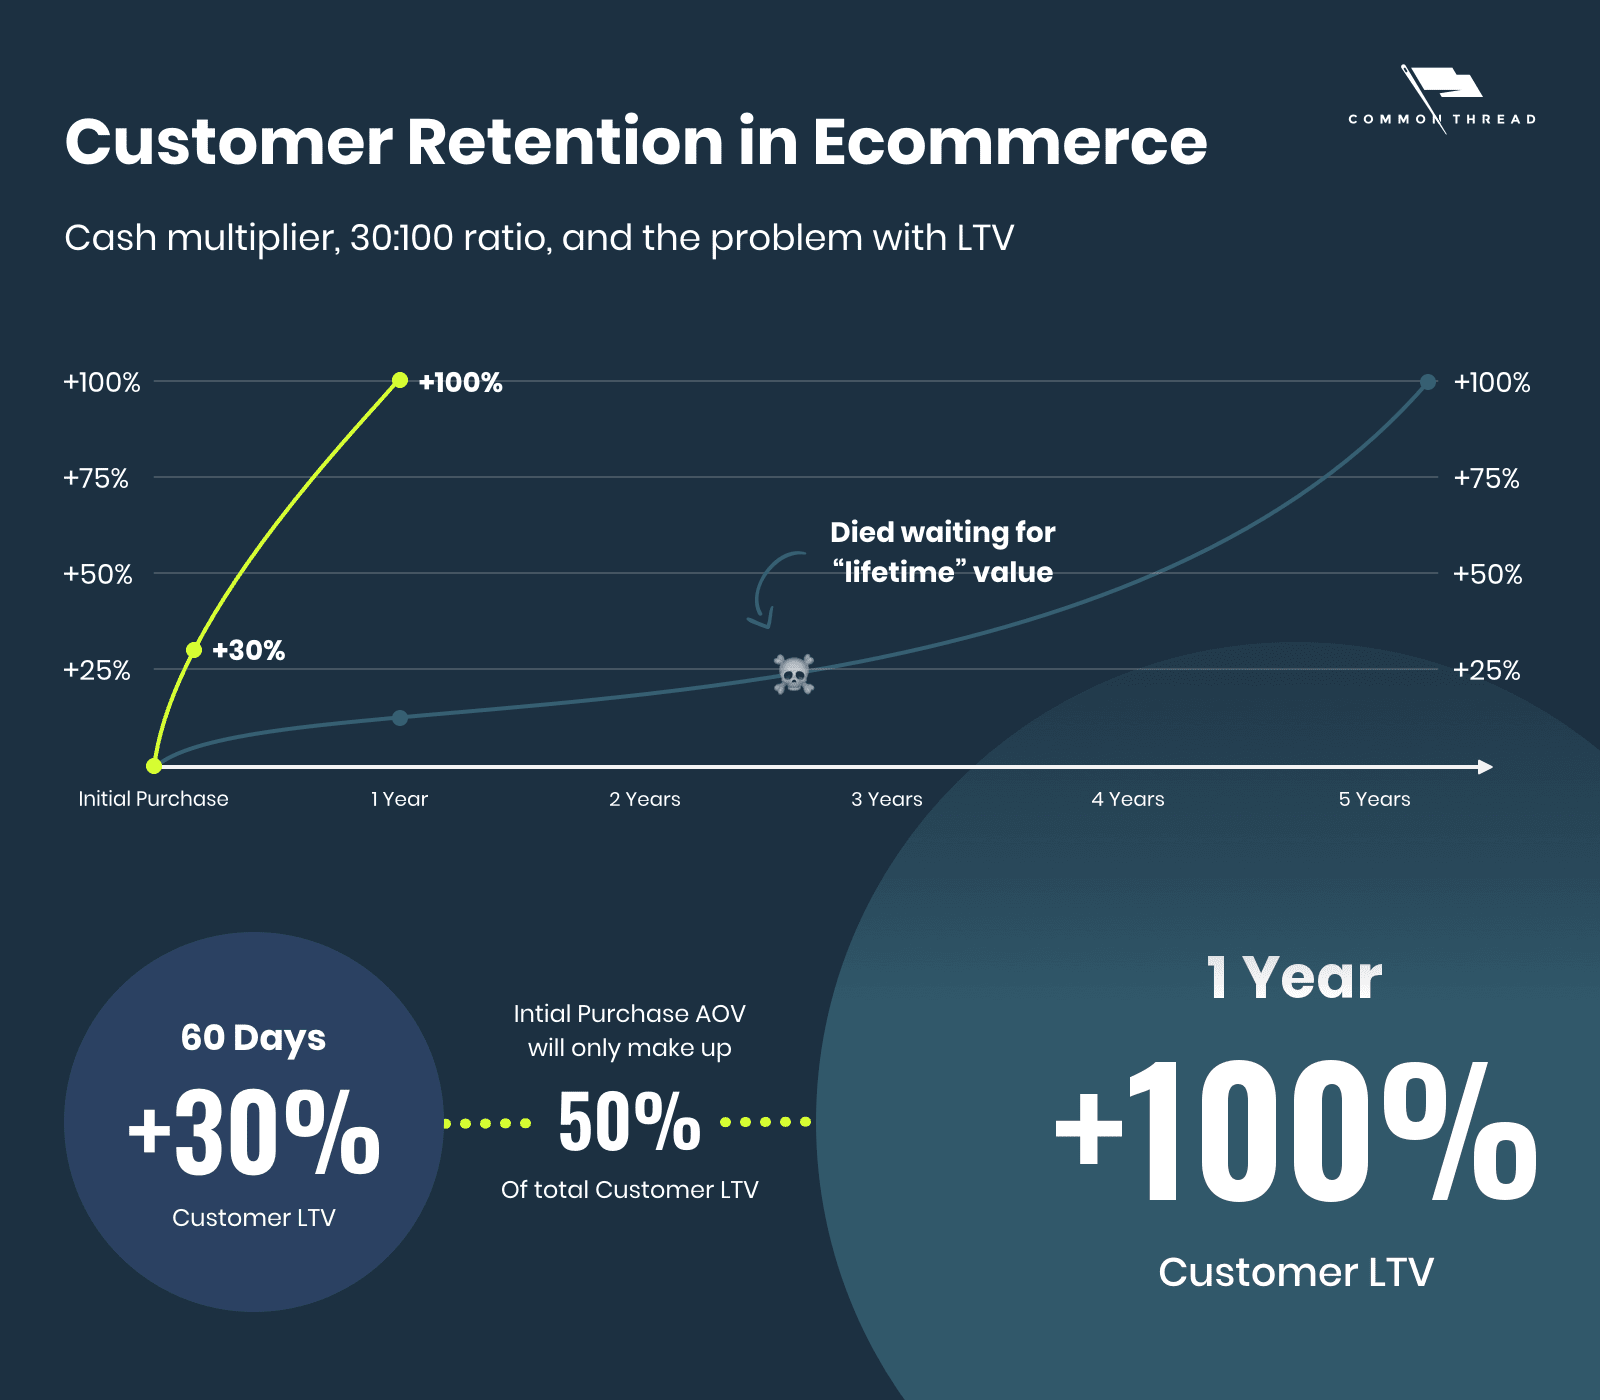
Full disclosure: Customer lifetime value is a terrible metric.
In ecommerce, where cash flow rules, you’ll die waiting a “lifetime.” Instead, you have to define and then optimize your customers’ incremental revenue within set timeframes.
We call it “cash multiplier.” Our version of LTV aimed at actualizing latent revenue within existing customers as quickly as possible.
The goal?
At least a 30% lift in first-purchase average order value (AOV) within 60 days and 100% within a year.
The Metrics: Cash Multiplier
Unfortunately, no ecommerce platform can tell you either of those numbers. Nor can it tell you which products and time frames have the highest customer retention rates.
This screaming need is why cash multiplier lies at the center of Statlas: figuratively and literally. Dead center.
It’s the first place we look for what’s broken.


Of course, other add-on tools can show you LTV.
Remember … Statlas isn’t the point. The idea is to place accelerating “lifetime” value at the center of your plan for growth.
The Benchmark: How Does Your LTV Increase Stack Up?
What does make Statlas unique is DTC-only benchmarking.
Without violating privacy, you can compare the health of your LTV to hundreds of other ecommerce stores.
For companies that sell subscriptions — like Bambu Earth — we use the entire data set (including outliers). For companies that don’t, we remove outliers.


The Opportunities: Time, Products & Offers
Your goal is to acquire customers today, whose future revenue will compound. Doing that requires answering three questions:
What are your customers worth after their first purchase?
Are some customers worth more than others?
If so, how much more and why?
LTV by Time: The ‘Golden’ Ratio
In order for LTV to hold financial value, it needs time-bounded constraints …
- 60 days: An immediate look at how valuable your customers are
- One year: How their purchase behavior affects long-term revenue
Less than 30% in the first 60 days? Then your products haven’t found a place in your customer’s daily lives.
Less than 100% in the first year? That’s a branding and marketing problem — you’ve failed to build genuine relationships.
For consumables or large-SKU companies, missing either goal means you don’t have the right product assortments. For single or limited-SKU companies you likely aren’t leaning into the right moments through a multi-peak marketing calendar.
LTV by SKU
Looking at LTV by first purchase shows you which SKUs provide value in the short term (customer journey) and long term (customer experience). Not only products they reorder; products that lead to other products.
Those same SKUs are likewise the key to increasing your (1) LTV percentage and (2) monetary returns.

This information is an absolute treasure trove of actionable insights. Among the opportunities it reveals …
- Which products to feature in top, middle, and bottom funnel ads
- How to set profitable ad costs and budgets for specific products
- Why some SKUs should be removed from acquisition campaigns
- What products to emphasize in email marketing and retargeting
- Where you need new product assortments, lines, or development
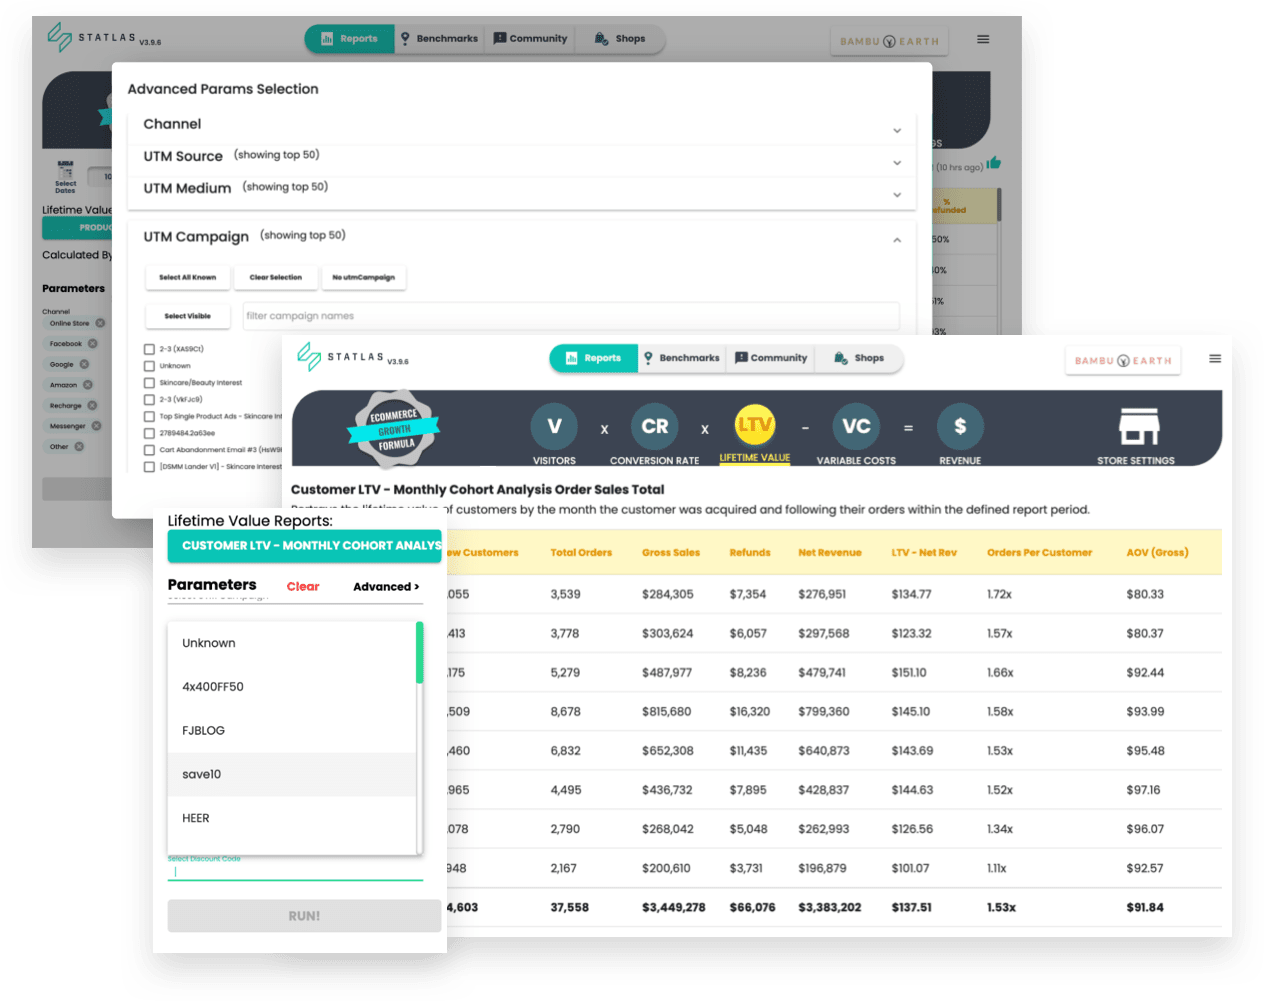
LTV by Offer
Lastly, if you’re running discounts or seasonal events, you’ll need to know how much money the customers acquired through those offers generate — initially and over time:
- Gross sales
- Net revenue
- Orders per customer
- And, gross AOV
As long as you or your agency is disciplined with UTMs, you can compare and contrast the short and long-term success of different campaigns. Replicating what worked; eliminating what didn’t.
Middle Layer: Owned Audiences
Visitors & Conversion Rate Optimization
Andrew Chen calls it the “law of shitty cohorts.” David Perell and Nik Sharma, the “customer acquisition pricing parade.”
My favorite phase is the end of arbitrage. Whatever name you choose, the principle is the same ….
The more customers a brand acquires, the more expensive its customer acquisition costs (CAC) become.
How do you win the fight?
By unearthing your best and worst performing organic channels: email, SMS, direct, social media, and search.
The Metrics: Traffic ‘Pie’ & Conversions
Early stage brands can scale on the back of paid visitors. As you move between $5M–$10M — and the moment you cross +$15M — reliance on paid becomes increasingly difficult.
Ironically, the best way to reduce CAC isn’t to reduce CAC. It’s to increase “free” sources.
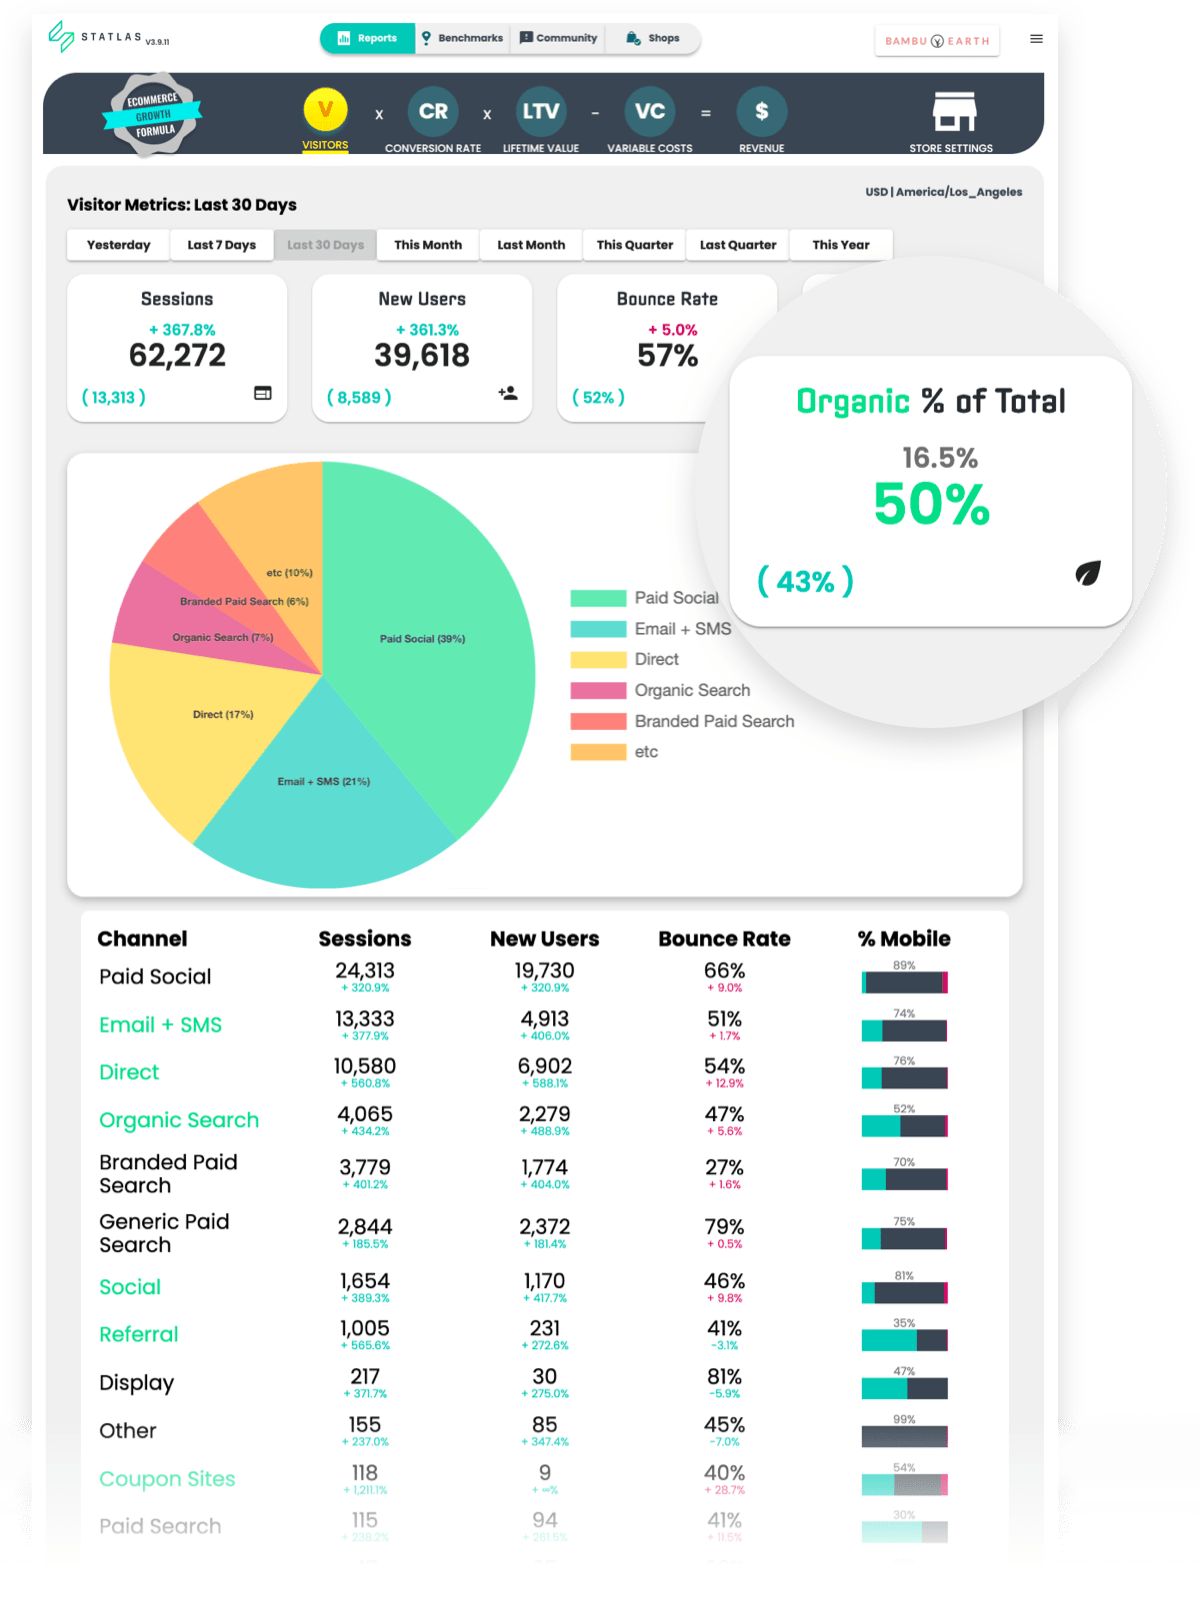
Typically, ecommerce operators focus on sessions (website visits), new users, and bounce rate. Statlas includes an additional metric — organic percent of total visitors by excluding all paid sources.
After traffic, high conversion rates are critical drivers of revenue. The trouble is sitewide performance can’t tell you much.
You want to know exactly where growth has stalled — i.e., what’s broken and what’s next.
This calls for a two-pronged approach: the big picture (forest) and the granular (trees).
First: the forest. Separating your digital marketing channels and devices gives you conversion rate’s big-picture performance.

Second: the trees. Evaluating your landing pages by (1) revenue and (2) conversion rate shows you the granular level. Likewise, it reveals where cart abandonment is high as well as where your checkout process can be improved.

The Benchmark: Where Do You Rank for Conversion Rates & AOV
Everybody wants to know if their online store’s conversion rate is “good.” Same with average order value (AOV).
In reality, conversion rate and AOV are inversely related. The higher your AOV, the lower your conversion rate. The higher your conversion rate, the lower your AOV.
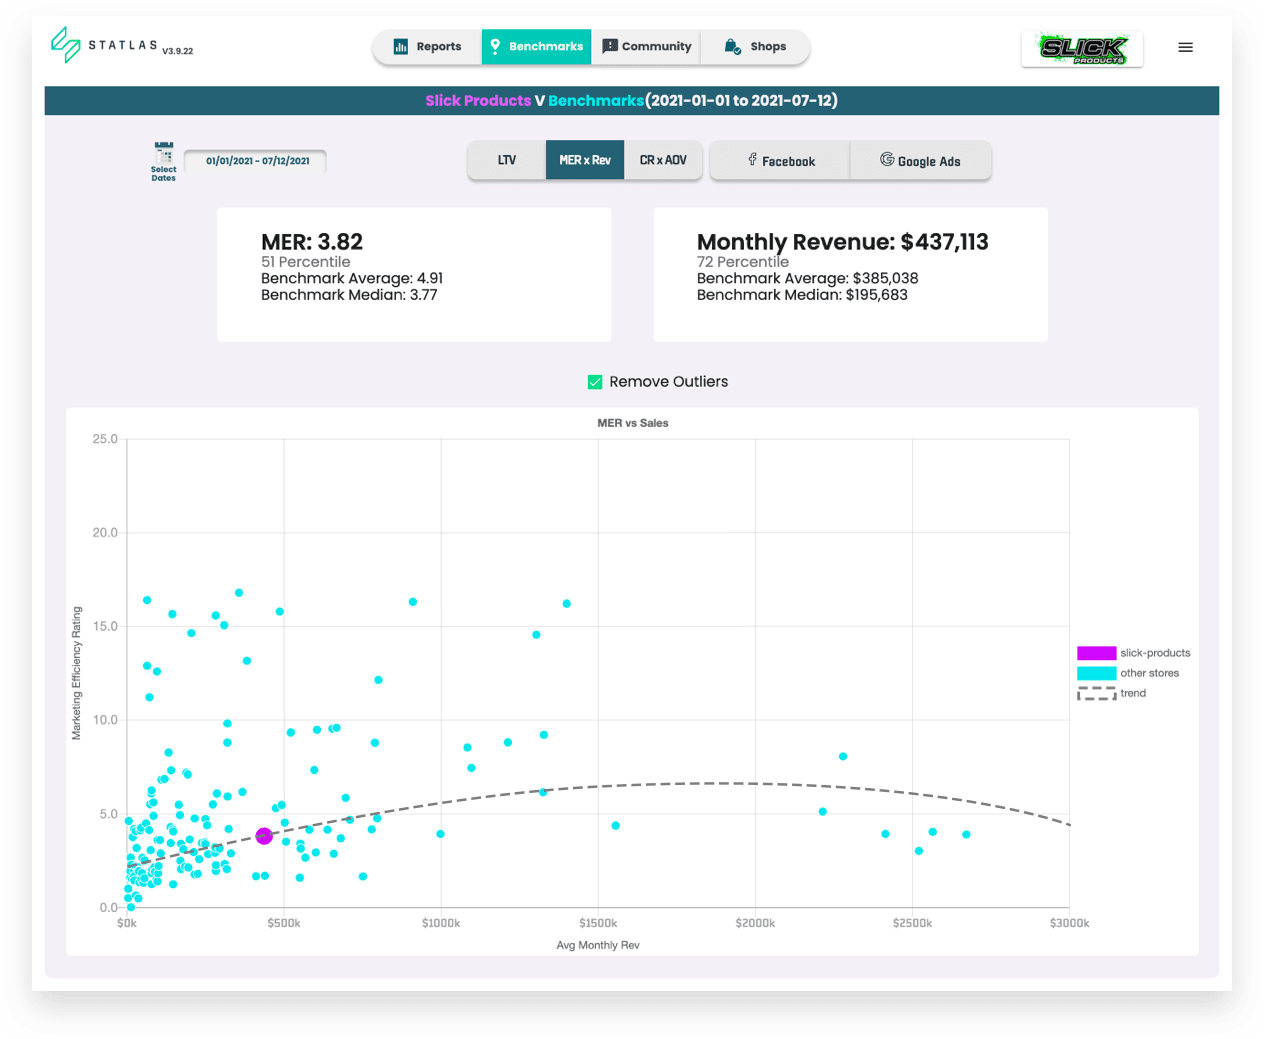
More than raw numbers, Statlas’ conversion rate and AOV benchmarking centers itself on the median value of a click — CR x AOV — and then draws a trendline to measure yourself against.
There’s no such thing as ‘good.’ There’s only …
Above the rest — beating the industry’s CR x AOV trendline. Then, above your best — beating your own historical baseline.
The Opportunities: Channels & AOV
Challenges and opportunities abound for visitors. To keep this as actionable as possible, we’ll examine:
What are your least underleveraged traffic sources?
What are your most overleveraged traffic sources?
What is your AOV? (No, I mean, your real AOV?)
Underleveraged Traffic Sources
Below, you’ll see a brand we recently began working with. This one we’ll keep anonymous, except to say that (like Bambu Earth) it’s also in the beauty industry and personal-wellness vertical.
What stands out?

Exactly, 70% of its 2021 traffic has been organic. Amazing, right?
Yes and no. Mostly, no. Having a strong organic presence is envious; however, not only is paid social media dramatically underutilized, far more alarming …
Email and SMS traffic are dangerously low.

With those numbers in front of us, it might be tempting to think: “The opportunities are obvious.” You’re right. Still, obvious revelations are only obvious with those numbers in front of you.
Overleveraged Traffic Sources
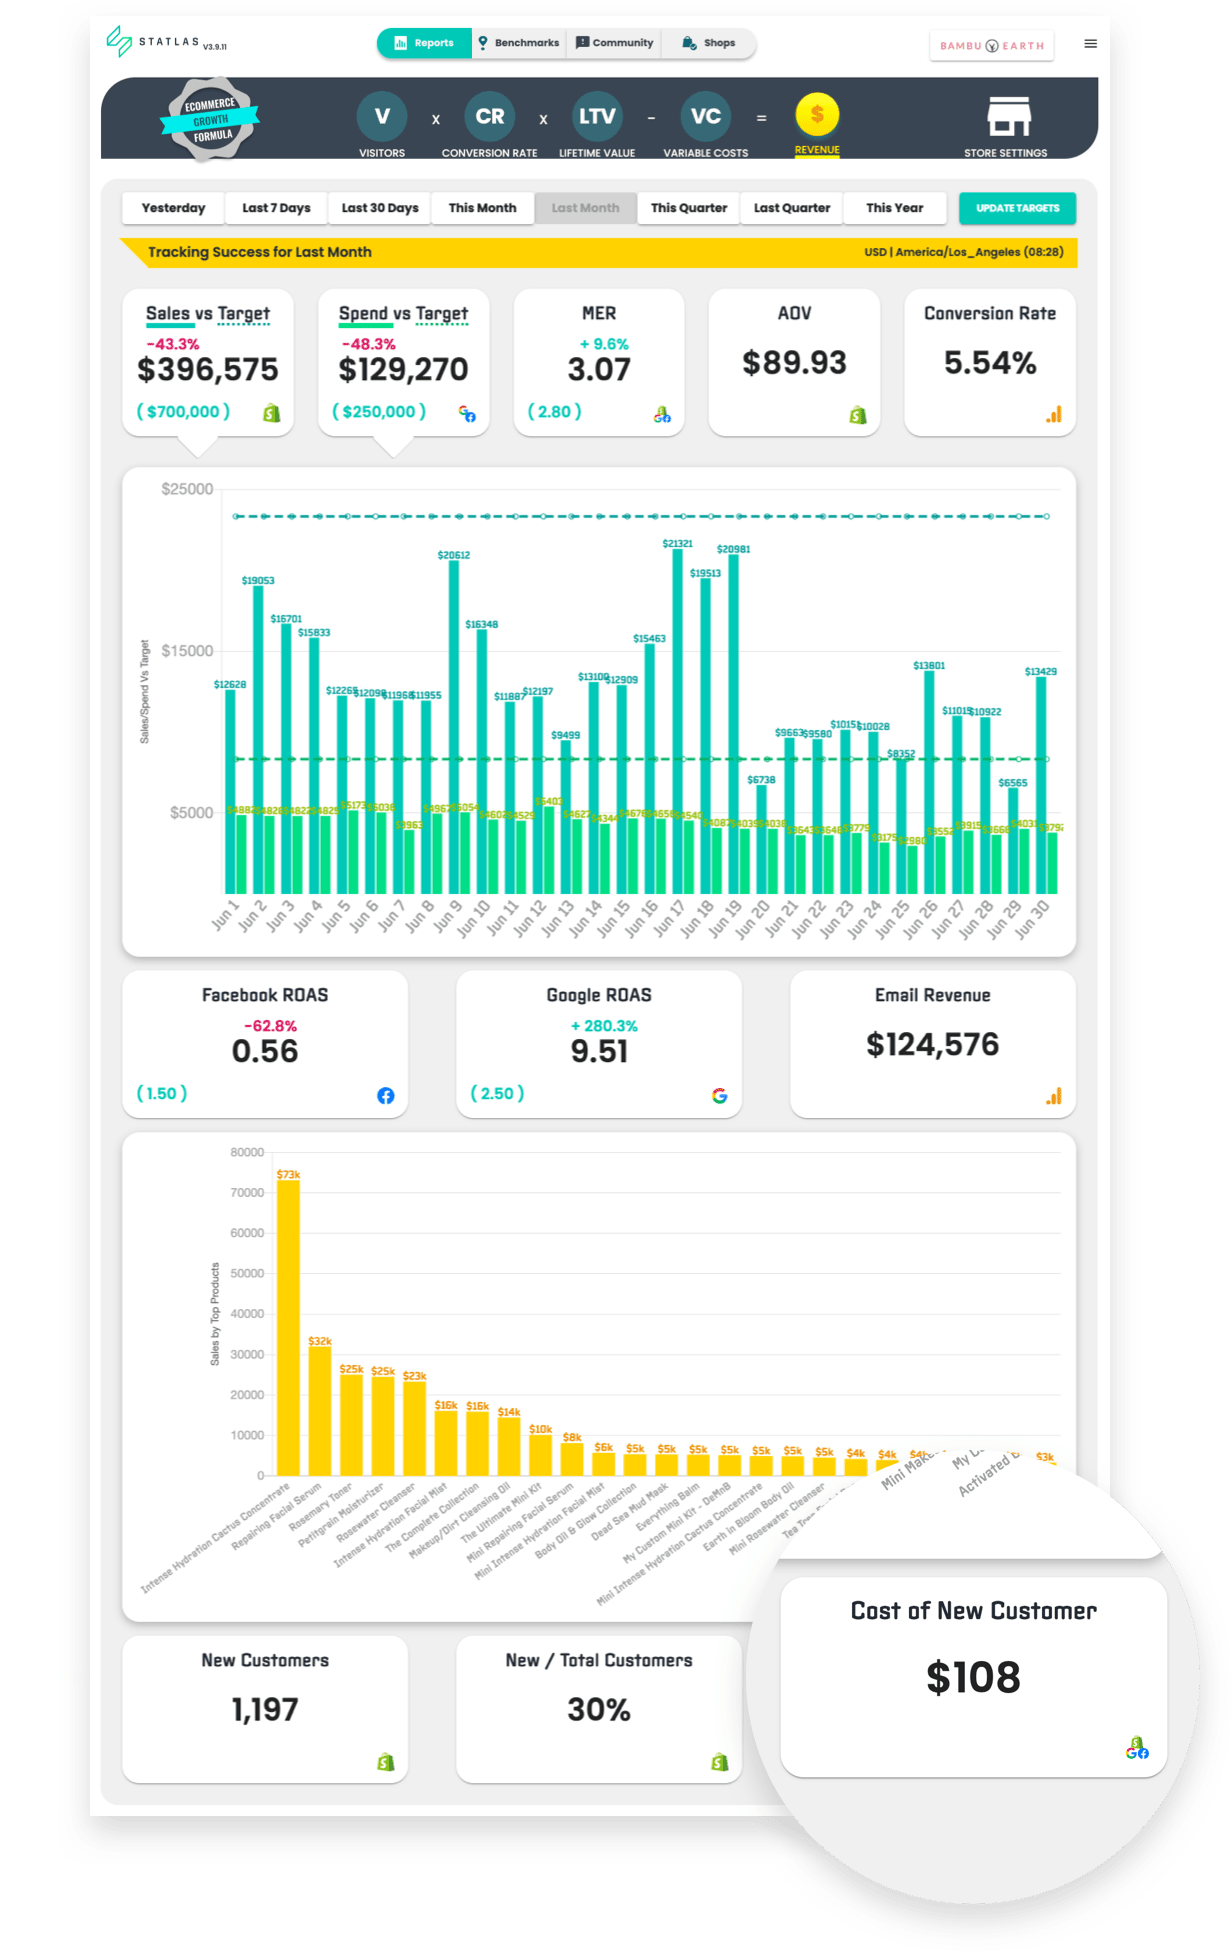
Our own brand, Slick Products, is essentially the opposite. Poor organic traffic from an overreliance on paid — namely, paid social.

This dependency eats away at margin. CAC inevitably rises the further you move from early adopters. Not only that, but it also forces you to “reacquire” existing customers; buying them multiple times.
Instead of more and better paid performance, focus has shifted onto brand-building efforts (something the CEO of our holding company detailed in a recent podcast):
- Influencer marketing and affiliates
- Content marketing, blogging, and SEO
- Finding and entering existing communities
Optimizing AOV, Your Real AOV
Much like LTV, AOV is a tricky and deceptive metric. Default analytics will tell you AOV equals total revenue divided by total orders.
Don’t believe the lie.
For example, Slick’s AOV is technically $72. You could “optimize AOV” through a variety of marketing strategies:
- Kitting and bundling
- Free-shipping thresholds
- Discount tiers by order value
- Subscriptions or gift offers
- Shopping cart suggestions
- Checkout upsells
- Post-purchase downsells
And yet, breakthrough growth doesn’t come from eking out a slight uptick from $72 to $75.
Why? Because $72 orders do not exist. It’s not a number that reflects real customer orders.
Rather, you want to identify AOV “buckets” — real order values placed by real people. AOV histograms do precisely that:
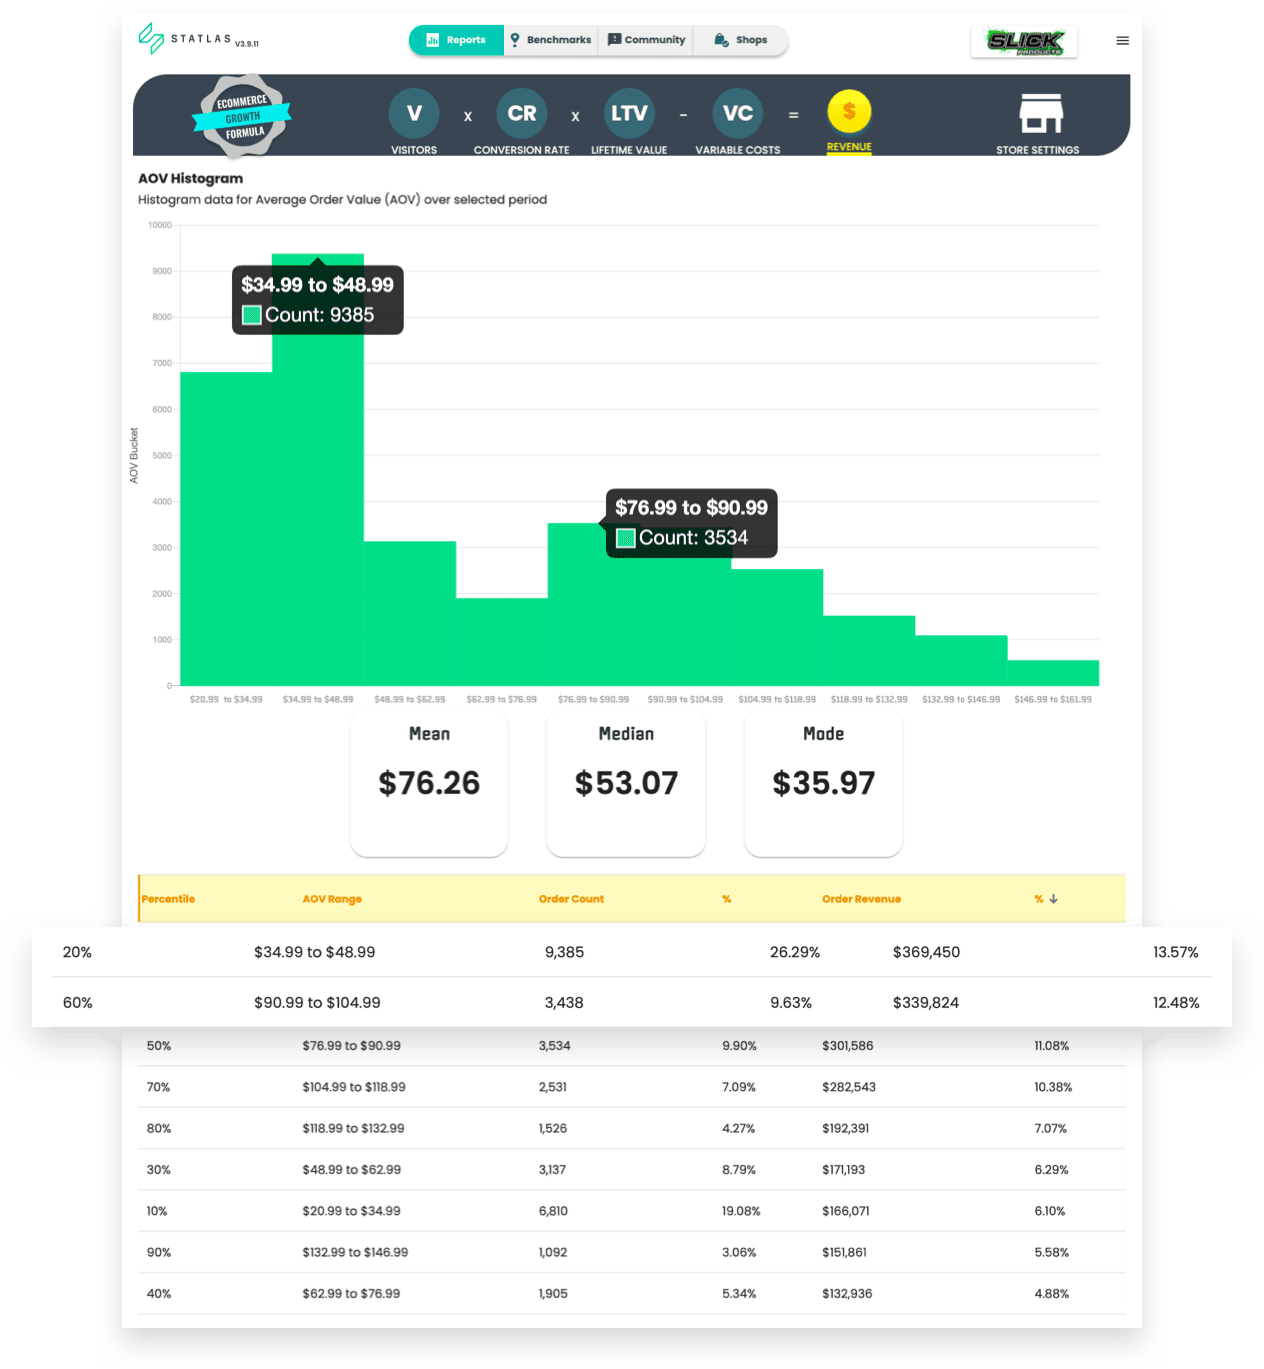
Sorted by order revenue, notice how wide the difference between Slick’s two most-ordered AOV buckets are: from lowest to highest, a $70 gap.
These are fundamentally different kinds of customers and therefore demand fundamentally different approaches.
The real opportunities lie in optimizing conversion rates for specific purchase types, “AOV buckets”: different creative, different funnels, different offers, different incentives, different costs.
Luckily, those are the topics we’ll turn to next …
Top Layer: Paid Acquisition
New Customers, CAC, Costs & Creative
At the top of the cake, we have the final layer — paid acquisition. And, it’s the least reliable due to high volatility.
Numerous outside factors affect online advertising: customer responsiveness, CPMs, conversion rates, ad creative, and (naturally) seismic shifts like iOS updates.
Nonetheless, paid acquisition is vital to your overall revenue model. Just so long as you’re tracking the right data.
The Metrics: Revenue, MER & CAC
Sales and Spend Targets
To begin, you want to see at a glance whether your sales and spend targets are on track. These should be comparison KPIs that instantly tell you where you are versus where you want to be.
In other words, where and when to pull back; where and when to push hard.

Marketing Efficiency Rating
Next, marketing efficiency ratio (MER) also known as blended ROAS equals total order revenue divided by total marketing spend.
At Common Thread Collective, we’ve always treated MER as our North Star. With so much confusion surrounding Facebook’s iOS updates and attribution tracking, its importance has only intensified.
This is how you determine if your spend is being allocated effectively and whether that spend makes sense for your bottom line. Again, you’ve got to have easy-to-access actuals versus goals.

Customer Acquisition Cost
CAC measures the total amount it costs to acquire a customer. Very often, you’ll treat this as the inverse of ROAS. Larger clients — specifically those prioritizing growth over profitability — lean into CAC targets above everything.
Surprisingly, new customer CAC (or, “weighted CAC”) doesn’t exist within Facebook nor any native ecommerce dashboard: total ad spend ÷ new customers.
The Benchmark: MER & Revenue
Healthy growth always improves efficiency. Up to a point.
That sounds paradoxical given two realities. First, CAC’s inescapable rise as you increase spend to increase reach. Second, CPMs’ recent skyrocketing post-COVID and post-iOS-updates.
Most online businesses between $5M–$10M in annual revenue develop some form of organic acquisition and some level of LTV as a byproduct of growth. However, even with outliers removed, maintaining ecommerce performance beyond that mounts in difficulty.
The Opportunities: Just Like Businesses, Ads Don’t ‘Break’
On the paid front, the final set of challenges we’ll address are perhaps the thorniest. Each one surrounds an acute pain point expressed by the same question. With very different answers …
Why aren’t our ads working? Comparative clarity
Why aren’t our ads working? Costs and clicks
Why aren’t our ads working? Creative
Comparative Clarity: Facebook & Google Last-Click
First and foremost, there’s a very good chance that — despite what Facebook Ads Manager is telling you — your ads are working.
iOS 14’s slammed into the ecommerce world with one refrain: “The sky is falling. Efficiency is dropping. The king is dead.”

I don’t want to downplay how difficult the last few months have been nor the “tempest” that lies ahead. At the same time, I do want to stress that much of the decline has been in Facebook reporting rather than Facebook itself.
Comparing Facebook reported ROAS and Google Analytics last-click is the only way to get clarity.
Of the three brands below, ROAS is …
- Up for both Facebook and Google Analytics
- Down for Facebook but up for Google Analytics
- Down for both but only half the drop for Google Analytics


If you’re in the third category and genuinely experiencing a reduction in Facebook campaign performance, the next opportunity becomes …
Costs & Click-Through Rates
CPMs are like the weather. All you can do is observe them, try your best to strike when it’s sunny … and complain during the storms. Right?
Sort of.
While supply and demand dictates the cost to advertise, a symbiotic relationship exists between CPMs, CTRs, and CPCs. The former, you can’t control (not much anyway). The latter, you absolutely can.
Let’s look at a year-to-date example from a women’s beauty brand:

Middling CPMs (47 percentile) + low CTR (7 percentile) = exorbitant CPC (88 percentile).
Here’s two more sets from the same vertical, both with much higher CPMs, strikingly different CTRs, and (therefore) wildly different CPC outcomes.

What’s the lesson?
If your ads ‘aren’t working’ and you’re blaming CPMs, you’re focusing on the part of the problem you can control the least.
Yes, the right Facebook account structure makes a big difference. So does audience targeting and demographics, getting your ads out of the Learning Phase, and staying on top of prospecting versus remarketing.
Far more important and far easier to influence is your messaging. Not only creative, but copy as well. Anything and everything to lift CTRs … especially during stormy seasons.
As one of our Growth Guides summarized it:
Identify the problem 👉🏻 CPM, CTR, AOV, or CVR.
— Sarah Carusona (@sarah_carusona) May 17, 2021
One of these is the outlier and needs your attention 👀
Then connect your problem to a solution 👇🏻
CTR = Creative
AOV = offer/product
CVR = landing page & CRO
CPM = account structure, creative, audiences (hardest to solve)
Thankfully, the question of creative will be the last we address.
Again, by the numbers!
Creative & AIDA Analytics
The ultimate goal of every ad is to sell. And yet, nobody just buys. Rather, they have to take a series of measurable actions that arrive at buying.
Those actions are best summarized through an age-old framework called AIDA: attention, interest, desire, and action.
Applied to your creative strategy …
- Attention: Your ad must stop the scroll (3-sec. view/imp.)
- Interest: Your ad must hold attention (Avg. watch time)
- Desire: Your ad must get someone to click (Outbound CTR)
- Action: Your ad must ultimately generate sales (ROAS)

Each stage builds on the last.
In other words, you can’t get more purchases without more clicks. You can’t get more clicks, without more engagement. You can’t get more engagement without getting more people to stop.
It’s possible to add custom metrics and set up an Ads Manager view to reflect AIDA, but two reports within Statlas help us to evaluate creative Facebook ads and make faster, more data-informed decisions.
Facebook AIDA Overview
Similar to conversion rate’s “forest,” the AIDA Overview gives you a big-picture view of your ad performance. Organize either by time frame or ad name and then easily sort by metric:

As for the “trees” …
Facebook AIDA Baseline
On the left, select the Adset Type. Then, on the right, sort by the AIDA metric you want to improve. For instance, prospecting campaigns with the highest Attention tells you which ads are stopping new people at the top of your funnel:

With two clicks, toggle to remarketing campaigns by ROAS for bottom-of-the-funnel results (or any other combination):

But, what about profitability?
True profitability can’t be achieved without variable costs. Without cost, there’s no clear path toward growth because it takes money to make money.
Are you looking to scale back on certain costs to increase margins? Are there low margin products that need revisiting?
The Variable Costs report breaks down the COGS for each product to clearly show your unit economics as well as your total margins.

Ecommerce Analytics for Breakthrough Growth
We’ve covered a lot of ground.
Truth be told, there’s plenty more we haven’t even touched on: Google Analytics Enhanced Ecommerce, email campaigns, A/B testing, customer behavior through heatmaps, and the unsexy but thoroughly-essential task of ecommerce tracking and UTM structures (i.e., tracking codes).
The list goes on and on.
So, let’s make the main thing, the main thing by ending where we started.
If your business knows the pain of stagnant growth, Statlas doesn’t have a monopoly on helping you diagnose what’s gone wrong. After all: Statlas isn’t the point.
The point is to consolidate your data for easy access and organize it around three layers of revenue: moving from the most reliable to least.
If this article has helped you think through how to unlock your next big opportunity, be sure to grab it as a guide.
And remember, businesses don’t break. Parts of businesses break. That means, the solutions aren’t “out there.” Instead, breakthrough lies within your data. You’ve just got to know where to look.
We won't send spam. Unsubscribe at any time.
Peter works on the business development team at CTC and is passionate about DTC brands and the ecommerce industry as a whole. He genuinely desires to see the industry continue to provide opportunities to entrepreneurs globally to pursue their dreams. He also loves to chat so feel free to connect with Peter on Twitter / LinkedIn or by reaching out directly to peter@commonthreadco.com.